How to Combine KoboToolbox, ODK and DHIS2 Data for Program Monitoring
Learn how NGOs can connect field data from KoboToolbox and ODK with DHIS2 and project monitoring workflows without replacing the systems they already use.
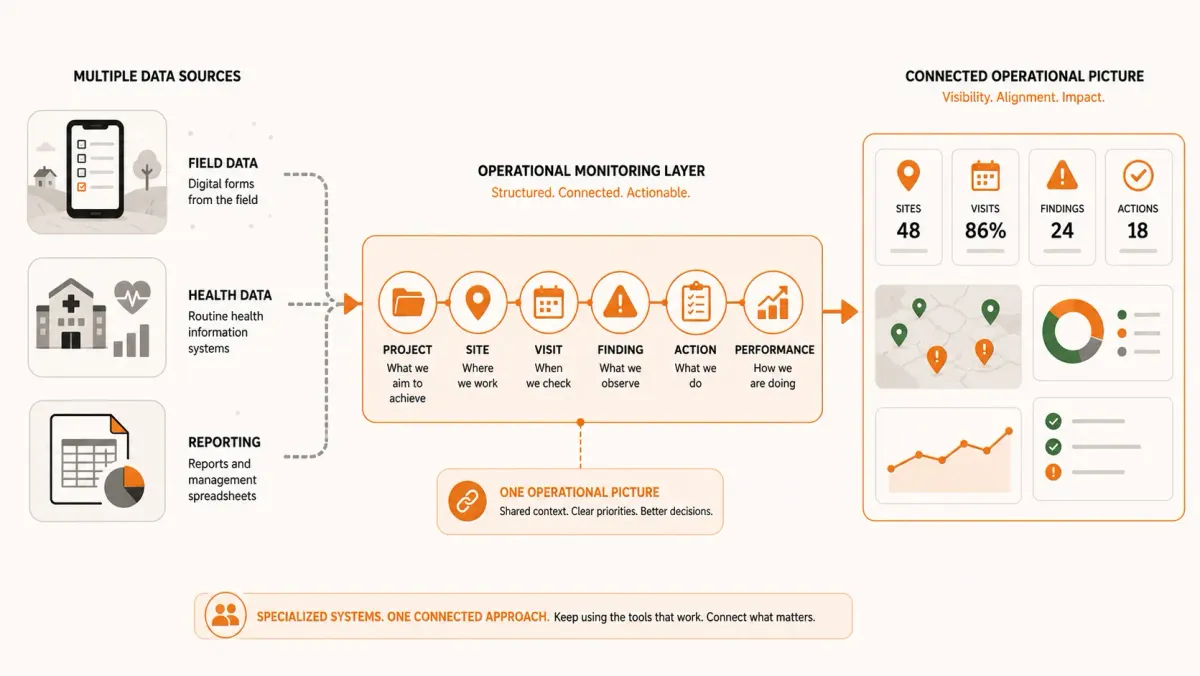
Many NGOs and development organizations already use digital systems to collect, manage and report program data.
One project may use KoboToolbox for field assessments.
Another may use ODK for routine monitoring.
A health program may use DHIS2 for routine health information.
The finance team may maintain budgets in a separate system.
Program teams may use Excel for tracking findings and corrective actions.
Management may receive monthly reports as PowerPoint presentations or PDFs.
Each system may work well for its intended purpose.
The problem begins when management asks a question that crosses those systems:
What is happening at our project sites, and what should we do about it?
Answering that question can require an M&E team to download KoboToolbox submissions, export ODK data, retrieve DHIS2 data, update an Excel tracker, reconcile site names, calculate indicators, review findings and prepare a management report.
The organization has plenty of data.
What it lacks is a connected operational picture.
This is one of the central challenges of modern M&E:
Data can be digital while the workflow remains fragmented.
This article explains how organizations can connect field data, routine indicators and project monitoring information without forcing every team to abandon the systems they already use.
Digital data does not automatically mean integrated data
An organization can be completely digital and still have fragmented M&E.
Consider a health project using three systems:
KoboToolbox
Used by field officers for supervision visits.
DHIS2
Used for routine health-service reporting.
Excel
Used by the project team for corrective-action tracking.
All three systems contain valuable information.
But they may not share the same operational structure.
For example, KoboToolbox may identify a facility as:
Kijiji Health Centre
DHIS2 may identify the same facility as:
Kijiji HC
An Excel tracker may contain:
Kijiji Health Ctr.
A person can recognize that these probably refer to the same location.
An automated system cannot safely assume that.
This creates one of the fundamental problems of M&E data integration:
The data may exist, but the relationships between the data are missing.
The real problem is usually not the data source
When teams discuss M&E integration, they often focus on the tools.
They ask:
Can KoboToolbox connect to DHIS2?
Or:
Can ODK connect to our reporting system?
Those are useful technical questions.
But the more important question is:
What operational information needs to be connected?
For example:
Project
↓
Site
↓
Monitoring Visit
↓
Field Evidence
↓
Indicator Performance
↓
Finding
↓
Corrective Action
The data may originate from several different systems.
The operational structure is what gives that data meaning.
KoboToolbox and ODK are excellent at field data collection
KoboToolbox and ODK are widely used for digital field data collection because they solve an important problem:
How do we collect structured information from the field?
A monitoring officer can use a mobile device to record:
- observations,
- survey responses,
- measurements,
- photographs,
- GPS information,
- and other evidence.
This can eliminate much of the paperwork associated with traditional data collection.
But collecting data is only one stage of the M&E process.
After the form is submitted, organizations still need to answer:
- Which project does this visit belong to?
- Which site was monitored?
- Was the visit expected?
- Was the site overdue?
- What did the monitoring team find?
- What corrective actions were created?
- Which indicators were below target?
- Has the issue been resolved?
- What happened during the previous visit?
A form submission does not necessarily answer all of these questions.
DHIS2 solves a different problem
DHIS2 is commonly used for managing health information and routine reporting.
It can provide valuable information about:
- service delivery,
- health indicators,
- facilities,
- reporting periods,
- organizational units,
- and program performance.
For example, a project may retrieve:
Facility A
Reporting period: July 2026
Indicator: Immunization coverage
Value: 72%
Target: 90%
This tells management something important:
Performance is below target.
But management may still need to ask:
Why?
That may require information from field monitoring.
A monitoring visit may reveal:
- vaccine stock-outs,
- staff shortages,
- incomplete registers,
- cold-chain problems,
- or reporting-quality issues.
The DHIS2 indicator tells you what happened.
Field monitoring may help explain why it happened.
The operational layer needs to connect the two.
The three-system problem
Consider an organization using:
ODK
for field monitoring.
DHIS2
for routine program indicators.
Excel
for corrective actions.
The workflow may look like this:
ODK → Field data
DHIS2 → Routine indicators
Excel → Findings and actions
Each system contains part of the story.
But management needs a connected picture:
Project → Site → Monitoring Visit → Field Evidence → DHIS2 Performance → Finding → Corrective Action → Follow-up
That is the difference between having data and having operational intelligence.
A common example: low indicator performance
Imagine a health project has a target of:
90% immunization coverage
DHIS2 reports:
72%
Management now knows that performance is below target.
But the number alone does not explain the cause.
The M&E team examines recent monitoring visits.
At three facilities, monitoring officers identified:
Facility A
Frequent vaccine stock-outs.
Facility B
Incomplete immunization registers.
Facility C
Low community outreach activity.
Now the organization has a much more useful picture.
The indicator provides the performance signal.
The monitoring data provides operational evidence.
The findings provide possible explanations.
The corrective actions define the response.
The next monitoring cycle can determine whether performance improves.
The workflow becomes:
DHIS2 performance → affected sites → monitoring evidence → findings → actions → follow-up
That is much more useful than reporting the indicator alone.
Why site identity is so important
The site is often the most important common reference point across M&E systems.
Consider:
KoboToolbox
Site ID: FAC-001
ODK
Site ID: FAC-001
DHIS2
Organisation Unit ID: abc123
These systems may use different identifiers.
A reliable integration therefore needs an explicit mapping:
FieldOps Site → Kobo/ODK identifier → DHIS2 organisation unit
Once that relationship exists, information from different systems can be associated with the same operational location.
This is far more reliable than repeatedly matching site names in Excel.
Why names alone are dangerous
Suppose one system contains:
St Mary's Health Centre
Another contains:
St Marys HC
Another contains:
St. Mary's Health Center
A person can probably determine that these refer to the same facility.
But automated matching based only on names can create errors.
Even worse, two different facilities may have similar names.
This can result in the wrong indicator value being associated with the wrong project site.
A robust integration therefore needs stable identifiers and explicit mappings.
Build a canonical site structure
A practical solution is to maintain a canonical site record.
For example:
Site
Internal ID: 1042
Name: Kijiji Health Centre
Project: Primary Health Project
External identifiers:
Kobo: KIJ-014
ODK: KIJ-014
DHIS2: abc123
The organization now has one operational site with relationships to multiple data sources.
This allows external systems to remain independent while still being connected operationally.
Do not force every system to become the same system
Integration does not mean replacing everything.
This is an important architectural principle.
KoboToolbox can continue doing what it does well:
Field data collection
ODK can continue doing what it does well:
Field data collection
DHIS2 can continue doing what it does well:
Health information and routine reporting
The organization can then introduce an operational layer responsible for connecting the information needed for:
- projects,
- sites,
- visits,
- findings,
- actions,
- and performance.
This avoids the temptation to turn one tool into something it was never designed to be.
The operational layer
An operational M&E layer should answer questions that individual source systems may not answer on their own.
For example:
Which sites belong to this project?
Which sites have been monitored this quarter?
Which sites are overdue?
Which sites have performance below target?
Which sites have unresolved findings?
Which corrective actions are overdue?
Which sites have recurring problems?
These questions require relationships between different kinds of information.
A useful architecture
A practical architecture can be understood as:
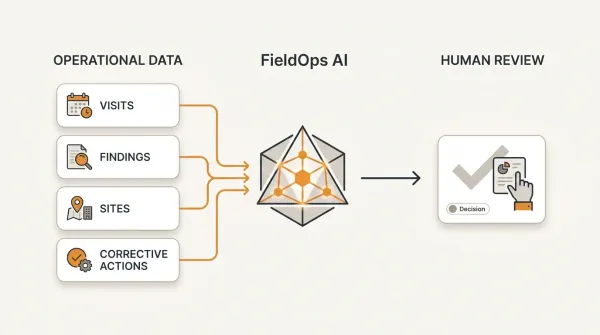
KoboToolbox → FieldOps
ODK → FieldOps
DHIS2 → FieldOps
The information is then organized around:
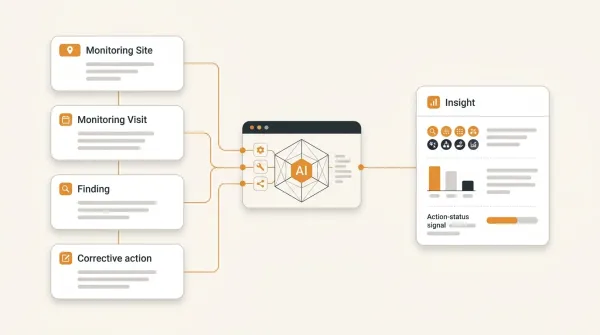
Organization → Program → Project → Site → Visit → Finding → Action → Performance
The source systems continue performing their specialized functions.
The operational layer connects the information required for project monitoring and management.
Integration should be selective
Not every piece of data needs to be synchronized.
This is another common mistake.
Organizations sometimes try to copy entire databases between systems.
That can create unnecessary complexity.
Instead, identify the information required for operational decisions.
For example, a project may need from KoboToolbox:
- monitoring visit date,
- site identifier,
- selected monitoring responses,
- evidence,
- findings.
From DHIS2:
- reporting period,
- selected indicators,
- organization unit,
- values,
- targets where available.
From the project system:
- project,
- site,
- monitoring schedule,
- responsible team.
Then combine those pieces around a common operational structure.
Start with the questions management needs answered
Before building an integration, identify the decisions the system needs to support.
For example:
Which sites are underperforming?
Which sites have not been monitored?
What findings have been identified at those sites?
Which corrective actions remain open?
Has performance improved after the corrective action?
These questions determine what data needs to be connected.
This is much better than starting with:
Let's import everything from DHIS2.
Example: connecting DHIS2 performance to field monitoring
Suppose DHIS2 contains:
| Site | Indicator | Period | Value | Target |
|---|---|---|---|---|
| Facility A | Coverage | Jul 2026 | 72% | 90% |
| Facility B | Coverage | Jul 2026 | 94% | 90% |
| Facility C | Coverage | Jul 2026 | 61% | 90% |
The operational layer can identify:
Facility A
Below target.
Facility C
Below target.
The system can then look at recent monitoring activity.
Facility A:
- stock-out finding,
- corrective action open.
Facility C:
- incomplete register finding,
- corrective action overdue.
Now management has an actionable picture.
The system can effectively answer:
Which underperforming sites also have unresolved operational problems?
That is a much stronger question than:
What is the average indicator value?
Performance and findings should reinforce each other
The relationship can work in both directions.
Direction 1: Performance → Findings
An indicator falls below target.
The organization investigates.
Monitoring identifies findings.
Corrective actions are created.
Direction 2: Findings → Performance
Repeated findings are identified.
The organization examines affected indicators.
Performance is monitored over time.
This creates a continuous improvement loop:
Performance → Investigation → Monitoring → Findings → Corrective Action → Follow-up → Performance
That loop is at the heart of effective program management.
Historical data matters
Integration should not only show the current period.
Organizations often need to understand trends.
For example:
| Month | Performance | Open findings |
|---|---|---|
| April | 68% | 12 |
| May | 71% | 10 |
| June | 76% | 8 |
| July | 82% | 5 |
This tells a useful story.
Performance is improving while unresolved findings are declining.
That does not prove causality.
But it gives management a useful signal to investigate.
Keep the source systems authoritative
A good integration architecture should preserve clear ownership of data.
For example:
DHIS2
Authoritative source for selected routine health indicators.
KoboToolbox / ODK
Authoritative source for field submissions.
FieldOps
Operational system for:
- project structure,
- sites,
- monitoring visits,
- findings,
- corrective actions,
- and monitoring workflows.
This prevents confusion about where information should be edited.
The integration should generally move data between systems without creating unnecessary competing versions of the same information.
Synchronization is not the same as integration
It is possible to synchronize data without creating useful integration.
For example:
We imported 10,000 DHIS2 records.
That tells management almost nothing.
A useful integration answers:
Which project sites are below target, which of those sites have been monitored, what did monitoring find, and which corrective actions remain unresolved?
The value is not the number of records synchronized.
The value is the decisions enabled by the connected data.
What happens when data synchronization fails?
Real integrations fail.
APIs can be unavailable.
Authentication can expire.
A site mapping can be missing.
A reporting period may not exist.
An external system may return an error.
A robust operational layer should therefore make synchronization observable.
For example:
Last successful DHIS2 sync: July 31, 2026
Records received: 1,248
Records matched: 1,216
Unmapped records: 32
Sync status: Partial
This is much safer than silently assuming everything synchronized correctly.
Unmapped sites should be visible
Suppose DHIS2 sends data for:
150 organisation units
but only:
143
have been mapped to project sites.
The remaining:
7
should not disappear silently.
The organization should be able to identify:
- which units are unmapped,
- why they are unmapped,
- and whether they should be linked.
This creates an explicit data-quality workflow.
Data integration should support auditability
M&E systems often operate in environments where data needs to be explainable.
A manager may ask:
Where did this performance value come from?
The system should be able to identify:
- source system,
- reporting period,
- external record,
- synchronization date,
- mapping,
- and processing status.
Similarly, if a finding came from a field visit, the organization should be able to trace it back to the relevant monitoring activity.
This creates an audit trail across the operational workflow.
Don't build another giant spreadsheet
When organizations discover that their systems do not integrate, the common response is:
Let's export everything to Excel and combine it.
This can be useful for exploratory analysis.
It becomes problematic when the spreadsheet becomes the permanent operational system.
The resulting workbook may contain:
- multiple sheets,
- VLOOKUP or XLOOKUP formulas,
- manually maintained mappings,
- copied exports,
- conditional formatting,
- pivot tables,
- macros,
- and manually updated status fields.
Eventually, very few people understand how the entire workbook works.
A structured system can make those relationships explicit instead.
When Excel still makes sense
Excel remains useful.
It is excellent for:
- ad hoc analysis,
- calculations,
- exploratory work,
- custom modeling,
- quick exports,
- and one-off reporting.
The problem is not Excel itself.
The problem is asking Excel to become the organization's permanent integration and workflow engine.
If the process requires:
- recurring synchronization,
- stable relationships,
- user permissions,
- audit trails,
- workflow states,
- site mappings,
- corrective actions,
- and historical records,
a dedicated system is usually a better foundation.
Where FieldOps fits
FieldOps is designed as an operational layer rather than a replacement for every data-collection or health-information system.
An organization can continue using its existing tools.
For example:
KoboToolbox / ODK
for field data collection.
DHIS2
for routine health information and indicators.
FieldOps
for connecting that information to:
- organization,
- program,
- project,
- site,
- monitoring visits,
- findings,
- corrective actions,
- and performance workflows.
This creates a connected operational model.
For example:
Organization → Program → Project → Site → Monitoring Visit → Findings → Corrective Actions → Performance
External systems can provide relevant information to that model.
The result is not another isolated database.
It is a structured operational layer that helps teams understand what their data means in the context of their projects.
Example: a complete monitoring workflow
Consider an NGO implementing a maternal-health project across:
100 facilities
The organization uses:
ODK
for quarterly facility monitoring.
DHIS2
for routine service indicators.
FieldOps
for project and monitoring management.
Step 1: Define the project
The project contains:
100 facilities
Step 2: Map external identifiers
Each FieldOps site is mapped to the relevant ODK and DHIS2 identifiers.
Step 3: Import performance data
DHIS2 provides selected indicators for the reporting period.
Step 4: Identify underperformance
The system identifies:
18 facilities below target.
Step 5: Review monitoring history
Of those 18 facilities:
14 have recent monitoring visits.
Step 6: Review findings
Those visits produced:
27 findings.
Step 7: Identify priority problems
The system identifies:
8 high-severity findings
and:
11 overdue corrective actions.
Step 8: Management intervention
Management can now prioritize the affected facilities.
This is much more useful than reviewing three separate exports.
The goal is not "one database"
Organizations sometimes assume that integration means putting all data into one database.
That is not always necessary.
The goal is:
One coherent operational picture.
KoboToolbox can remain the field-data collection platform.
ODK can remain the field-data collection platform.
DHIS2 can remain the health-information platform.
Excel can remain useful for analysis.
FieldOps can provide the operational structure that connects the information needed for project monitoring.
This distinction matters.
A field-data collection platform does not have to become a project-management platform.
A health-information system does not have to become a corrective-action tracker.
A monitoring system does not have to replace every data-collection tool.
Each system can remain specialized.
The operational layer provides the relationships between them.
A practical integration strategy
Organizations considering integration can start small.
Step 1: Choose one project
Do not begin by integrating the entire organization.
Step 2: Identify the sites
Create a clean project-site structure.
Step 3: Map identifiers
Connect internal site IDs with the corresponding KoboToolbox, ODK or DHIS2 identifiers.
Step 4: Select the required data
Import only the indicators and field data required for the project's decisions.
Step 5: Establish synchronization
Define when data should be refreshed.
Step 6: Validate mappings
Identify unmapped sites and records.
Step 7: Connect monitoring
Associate field activity with project sites.
Step 8: Connect findings
Associate findings with monitoring visits.
Step 9: Track actions
Assign and follow up corrective actions.
Step 10: Connect performance
Compare operational findings with indicator performance.
Step 11: Expand gradually
Once the workflow works for one project, apply the model to additional projects.
This approach is generally more manageable than attempting a large organization-wide integration project immediately.
What successful integration should feel like
The M&E manager should not have to think about which system contains which piece of information.
Instead, they should be able to start from the project.
For example:
Project: Maternal Health Quality Improvement
Then see:
Sites: 100
Monitoring coverage: 91%
Sites below target: 18
Open findings: 43
High-severity findings: 8
Overdue actions: 11
Then drill down to a specific facility.
Facility A
Performance: below target.
Last monitoring visit: July 12.
Findings: 3.
High-severity findings: 1.
Open actions: 2.
Overdue actions: 1.
This is the kind of operational context that fragmented exports struggle to provide.
The deeper lesson
The M&E technology problem is often described as:
We have too many systems.
But the deeper problem is frequently:
We have too few connections between the systems.
Organizations do not necessarily need fewer tools.
They need clearer roles and reliable relationships between those tools.
KoboToolbox can collect field evidence.
ODK can collect field evidence.
DHIS2 can manage routine health information.
Excel can support analysis.
An operational monitoring layer can connect the information needed to manage projects, sites, monitoring, findings and actions.
Conclusion
Organizations do not need to choose between field-data collection and operational monitoring.
KoboToolbox, ODK and DHIS2 can continue performing the functions they are good at.
The missing piece is often the layer that connects their information to the operational structure of a project.
That structure can be:
Organization → Program → Project → Site → Visit → Finding → Action → Performance
Once the relationships are established, organizations can answer more useful questions:
- Which sites are being monitored?
- Which sites are overdue?
- Which sites are underperforming?
- What did the monitoring team find?
- Which findings remain unresolved?
- Which corrective actions are overdue?
- Are recurring problems improving?
- Is program performance changing over time?
The objective is not to collect more data.
It is to make the data already being collected operationally useful.
Digital systems become powerful when they are connected around the decisions an organization needs to make.
For NGOs using KoboToolbox, ODK and DHIS2, the next step does not necessarily need to be replacing those systems.
It can be creating the operational layer that connects their data to projects, sites, monitoring, findings, actions and performance.
Key takeaways
-
Digital data is not automatically integrated data.
-
KoboToolbox, ODK and DHIS2 can each perform specialized functions without providing a complete operational monitoring workflow.
-
A common site structure is one of the most important foundations for integrating M&E data.
-
Stable identifiers are safer than matching sites by name.
-
Performance data can identify where problems exist, while monitoring data can help explain what is happening operationally.
-
Findings and corrective actions can provide the bridge between performance information and management action.
-
Organizations do not necessarily need to replace existing systems to improve their M&E workflow.
-
Integration should focus on the information required for decisions rather than copying every available record.
-
Synchronization failures and unmapped records should be visible rather than silently ignored.
-
The goal of integration is not necessarily one database; it is one coherent operational picture.
-
FieldOps can provide an operational layer connecting projects, sites, visits, findings, actions and performance with information from existing systems.
Frequently asked questions
Can KoboToolbox and DHIS2 be used together?
Yes. They can serve different purposes within the same M&E architecture. KoboToolbox can support field data collection while DHIS2 can provide routine health information. The important challenge is creating reliable mappings and relationships between the information generated by each system.
Can ODK and DHIS2 be integrated?
Yes. Organizations can integrate selected ODK field data with DHIS2 information where there is a clear operational requirement. The integration should define which records need to be connected, how sites are identified and how data synchronization is validated.
How do you combine KoboToolbox and DHIS2 data?
A practical approach is to establish a common site structure, map Kobo identifiers to DHIS2 organisation units, select the required data from each system and connect the resulting information around projects, sites, monitoring visits and performance.
What is the biggest challenge when integrating KoboToolbox, ODK and DHIS2?
One of the biggest challenges is establishing reliable relationships between records from different systems. Different systems may use different identifiers, site names, reporting periods and data structures. Explicit mappings and validation are therefore important.
Should an NGO replace KoboToolbox or ODK when implementing a monitoring system?
Not necessarily. If the existing data-collection system works well for field teams, it may be more effective to keep it and add an operational layer for project, site, monitoring, findings and corrective-action management.
Can DHIS2 show why an indicator is underperforming?
DHIS2 can show indicator performance and related health-information data, but understanding the operational reasons behind underperformance may require additional monitoring evidence, site-level assessments and findings.
Why is site mapping important in M&E data integration?
A site can appear under different names or identifiers in different systems. Mapping provides an explicit relationship between those records and reduces the risk of associating data with the wrong project site.
What should an M&E integration system synchronize?
It should synchronize the information required for operational decisions. This may include selected indicators, reporting periods, site identifiers, monitoring submissions, findings and other relevant records. Importing everything is not necessarily better.
What should happen when a DHIS2 record cannot be mapped to a project site?
The unmapped record should be identified and made visible for review. It should not silently disappear or be automatically assigned to a site based only on an uncertain name match.
What is the difference between data integration and data synchronization?
Synchronization moves or updates data between systems. Integration goes further by creating meaningful relationships between that information so that it can support operational workflows and decisions.
How does FieldOps fit with KoboToolbox, ODK and DHIS2?
FieldOps can serve as an operational monitoring layer around existing systems. Instead of requiring an organization to replace its field-data collection or health-information platforms, it can connect relevant information to projects, sites, monitoring visits, findings, corrective actions and performance.
Move beyond data collection
FieldOps helps NGOs manage field visits, monitoring templates, findings, corrective actions, dashboards and donor reporting in one operational intelligence platform.
Learn more about FieldOps