How to Track Monitoring Visits Across Multiple Project Sites
Learn how NGOs and M&E teams can track monitoring visits, identify overdue sites, measure monitoring coverage and maintain a complete history of field monitoring.
For organizations managing projects across many locations, one of the simplest M&E questions can become surprisingly difficult to answer:
Which project sites have actually been monitored?
A project may have 50 sites.
Another may have 120.
A regional program may operate across several counties or districts.
Each site may be expected to receive monitoring visits monthly, quarterly or according to a project-specific schedule.
On paper, the requirement is straightforward.
In practice, M&E teams often rely on a combination of:
- Excel trackers,
- KoboToolbox submissions,
- ODK forms,
- emails,
- calendars,
- Word reports,
- WhatsApp messages,
- shared folders,
- and manually updated monitoring schedules.
A monitoring officer may know which sites they visited.
The project manager may have another spreadsheet.
The M&E manager may have a different report.
Senior management may simply receive a percentage such as:
"Monitoring coverage is 82%."
But what does 82% actually mean?
Which sites were visited?
Which were missed?
Which are overdue?
Which visits are still being reviewed?
Which sites have not been monitored for three months?
And which sites have repeated monitoring gaps?
These questions require more than collecting monitoring data.
They require a monitoring workflow.
The core structure is:
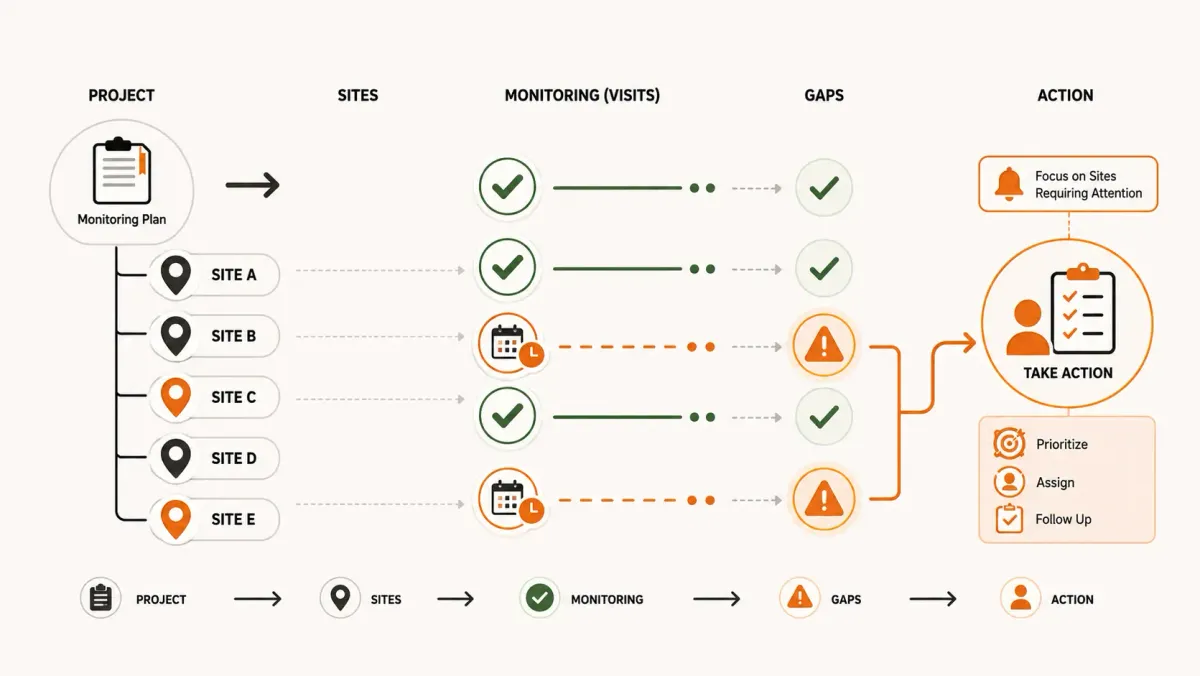
Project → Site → Monitoring Schedule → Visit → Status → Findings → Follow-up
Monitoring coverage is more than a percentage
Suppose a project has:
100 sites
and the monthly monitoring report says:
Monitoring coverage: 90%
At first glance, that sounds good.
But management should still be able to ask:
Which 10 sites were not monitored?
If the answer requires manually checking a spreadsheet, the coverage figure is not enough.
The organization needs to know:
- which sites were missed,
- how long they have been overdue,
- why they were missed,
- who was responsible,
- and when they are expected to be monitored.
A useful monitoring system therefore treats coverage as a site-level operational measure, not simply a percentage in a report.
The difference between planned and completed visits
A monitoring visit can exist in several states.
For example:
Planned
A visit is expected but has not started.
Scheduled
A date has been assigned.
In progress
The monitoring activity has started.
Submitted
The field officer has completed and submitted the visit.
Under review
The visit is being reviewed.
Approved
The monitoring result has been accepted.
Overdue
The expected monitoring deadline has passed without a completed visit.
These states tell very different stories.
Consider:
100 planned visits
82 submitted
10 in progress
5 under review
3 overdue
Simply reporting "82% completed" hides important operational information.
Why Excel monitoring schedules become difficult
Excel is often the first solution.
A tracker might contain:
| Site | Planned date | Officer | Status |
|---|---|---|---|
| Site A | Aug 5 | Officer 1 | Completed |
| Site B | Aug 7 | Officer 2 | Completed |
| Site C | Aug 8 | Officer 3 | Pending |
| Site D | Aug 10 | Officer 1 | Overdue |
This works well for a small number of sites.
But as the program grows, the spreadsheet becomes more complicated.
The organization may need to track:
- multiple projects,
- regions,
- counties,
- sites,
- monitoring officers,
- visit types,
- planned dates,
- actual dates,
- visit status,
- findings,
- corrective actions,
- review status,
- evidence,
- and follow-up visits.
The spreadsheet starts becoming a database and workflow application.
At that point, maintaining it accurately becomes difficult.
The hidden problem: who is responsible for each site?
Consider a project with 80 sites and 12 monitoring officers.
If the monitoring schedule exists only as a spreadsheet, the M&E manager may have to manually determine:
- which officer owns which sites,
- which visits are due,
- which visits are overdue,
- and whether the officer has already submitted a visit.
A structured system can make these relationships explicit.
For example:
Project
Primary Health Improvement
↓
Site
Kijiji Health Centre
↓
Assigned monitor
Monitoring Officer A
↓
Next visit
August 28
↓
Status
Due
Now the organization has an operational record rather than a manually maintained note.
Site-level monitoring history is essential
Suppose a manager asks:
When was Facility A last monitored?
The answer should not require opening multiple reports.
The site should have a monitoring history.
For example:
Facility A
January 12
Routine monitoring
April 18
Routine monitoring
July 15
Routine monitoring
Next visit
October 15
This allows the organization to understand monitoring continuity.
It also makes gaps visible.
Monitoring gaps can create blind spots
Imagine five sites have not been monitored for six months.
The organization may still have current routine data from those sites.
That can create a false sense of visibility.
Routine reporting may show:
Performance data available.
But monitoring evidence may be missing.
This distinction matters because routine data and monitoring visits answer different questions.
Routine data may tell you:
What was reported?
A monitoring visit may help determine:
What is actually happening at the site?
Both can be valuable.
Monitoring frequency should match the project
Not every project needs the same monitoring schedule.
One project may require:
Monthly monitoring
Another:
Quarterly monitoring
Another:
Semi-annual monitoring
A system should therefore allow monitoring requirements to be defined according to the project's operational needs.
For example:
Project A
Monthly site visits.
Project B
Quarterly site visits.
Project C
Risk-based monitoring.
The schedule should reflect the project's monitoring strategy rather than forcing every project into the same model.
Risk-based monitoring is often better than treating every site equally
Suppose an organization has 200 sites.
Monitoring every site every month may be unrealistic.
Instead, the organization may classify sites according to risk.
For example:
High risk
Monthly monitoring.
Medium risk
Quarterly monitoring.
Low risk
Semi-annual monitoring.
Risk may be determined by factors such as:
- previous findings,
- performance,
- reporting quality,
- safeguarding concerns,
- implementation complexity,
- or other project-specific factors.
This allows monitoring resources to be prioritized.
Monitoring history can help determine risk
Historical monitoring data can itself become a risk signal.
Consider:
Site A
No major findings in the past year.
Site B
Two medium-severity findings.
Site C
Five recurring high-severity findings.
The three sites should probably not receive identical management attention.
A structured monitoring history makes this pattern easier to identify.
Overdue visits need more than a red cell
In an Excel tracker, an overdue visit might simply be highlighted red.
That is useful visually.
But management may need to know:
- how many days overdue,
- responsible officer,
- project,
- site,
- previous visit,
- previous findings,
- and reason for delay.
For example:
Site C
Project: Nutrition Program
Last visit: April 12
Next visit due: July 12
Days overdue: 47
Assigned officer: Officer 3
Previous high-severity findings: 2
This is a much stronger management signal.
Monitoring coverage should be measurable by project
An organization may have:
Project A
95% monitoring coverage.
Project B
81%.
Project C
62%.
A portfolio-level average might show:
79%
But that average hides the difference between projects.
Project C requires attention.
The system should therefore allow monitoring coverage to be viewed at multiple levels:
Organization
↓
Program
↓
Project
↓
Site
This gives management both the portfolio view and the operational detail.
Coverage can also be measured by period
For example:
| Month | Planned visits | Completed | Coverage |
|---|---|---|---|
| April | 100 | 92 | 92% |
| May | 100 | 88 | 88% |
| June | 100 | 79 | 79% |
| July | 100 | 84 | 84% |
This reveals a trend.
Coverage declined in June and recovered somewhat in July.
Management can then investigate the cause.
A single annual coverage percentage would hide this pattern.
A visit should have a clear status lifecycle
A monitoring visit should not simply exist as "submitted" or "not submitted."
A structured lifecycle might be:
Planned
↓
Scheduled
↓
In progress
↓
Submitted
↓
Reviewed
↓
Approved
This creates an auditable workflow.
For example, a manager can distinguish:
Visits not conducted
from:
Visits conducted but awaiting review
Those are operationally different problems.
Submission is not the same as approval
This distinction is especially important.
Suppose:
100 visits planned
90 submitted
75 approved
The project cannot simply report:
90% monitoring completed
without explaining the remaining 15 submissions.
They may be:
- awaiting review,
- missing evidence,
- returned for correction,
- or otherwise incomplete.
The monitoring workflow should therefore distinguish the states.
Returned visits need to remain visible
A monitoring visit may be returned because:
- required questions were not completed,
- evidence was missing,
- findings were unclear,
- or the review identified inconsistencies.
If the visit disappears from the monitoring schedule after submission, management may incorrectly assume it is complete.
A structured status history prevents this.
For example:
Submitted
↓
Returned
↓
Corrected
↓
Resubmitted
↓
Approved
This creates a complete audit trail.
Monitoring schedules should survive staff changes
Staff turnover is common in development programs.
Suppose a monitoring officer leaves the organization.
If monitoring schedules exist primarily in that person's spreadsheet or email account, continuity can be lost.
A structured system keeps the monitoring history associated with the:
Project
and:
Site
rather than only with the individual officer.
A new officer can therefore see:
- previous visits,
- findings,
- outstanding actions,
- upcoming visits,
- and site history.
This protects institutional knowledge.
A monitoring visit should not be an isolated form submission
A form submission may contain:
- date,
- responses,
- photographs,
- GPS,
- observations.
But an operational monitoring record should provide context.
For example:
Project
Primary Health Improvement
Site
Kijiji Health Centre
Visit type
Routine supervision
Planned date
August 20
Actual date
August 22
Monitor
Officer A
Status
Approved
Findings
3
Open corrective actions
2
This is much more useful than an isolated form response.
Connect monitoring visits to findings
A monitoring visit may identify several findings.
For example:
Visit
August 22
Findings
-
Incomplete records.
-
Stock documentation missing.
-
Staff refresher training required.
Each finding can then generate a corrective action.
This creates:
Site → Visit → Finding → Action
The monitoring visit becomes the beginning of a workflow rather than the end of one.
Connect monitoring to previous findings
The next visit should provide continuity.
The monitoring officer may see:
Previous findings
Finding 1
Incomplete records.
Status: Closed.
Finding 2
Stock documentation missing.
Status: Open.
Finding 3
Staff training required.
Status: Overdue.
The officer can then determine whether these issues have been resolved.
This avoids repeatedly starting from a blank form.
Monitoring coverage should not be confused with monitoring quality
A project can achieve:
100% monitoring coverage
and still have weak monitoring.
Why?
Because coverage measures whether visits occurred.
It does not necessarily measure:
- quality of evidence,
- quality of findings,
- follow-up,
- action completion,
- or usefulness of the visit.
A mature M&E system should therefore track both:
Monitoring activity
and:
Monitoring outcomes
Useful monitoring KPIs
Organizations can track metrics such as:
Monitoring coverage
Percentage of planned visits completed.
On-time monitoring rate
Percentage of visits completed by the planned deadline.
Overdue visits
Number of visits past their expected date.
Average monitoring delay
Average number of days between planned and actual visit dates.
Findings per visit
Average number of findings identified.
High-severity findings
Number of high-severity issues identified.
Corrective-action closure rate
Percentage of actions resolved and verified.
Recurring finding rate
Percentage of findings repeated from previous visits.
These metrics provide a much richer picture than a single coverage percentage.
Monitoring delays should be analyzed
Suppose a project has:
90% monitoring coverage
but:
40% of visits were completed more than 30 days late.
The coverage figure alone makes the project appear healthy.
The delay metric reveals a problem.
This is why organizations should distinguish:
Did the visit happen?
from:
Did the visit happen when it was supposed to?
A monitoring dashboard should lead to action
A dashboard should not simply display attractive numbers.
For example:
Monitoring coverage: 86%
Overdue visits: 14
High-risk sites not monitored: 5
Open high-severity findings: 11
These numbers should be clickable or traceable to the underlying sites.
The M&E manager should be able to move from:
Overdue visits: 14
to:
Site → Project → Assigned officer → Last visit → Findings → Next action
That is where monitoring data becomes operationally useful.
A practical site monitoring register
A structured register might contain:
| Field | Example |
|---|---|
| Project | Primary Health Improvement |
| Site | Kijiji Health Centre |
| Monitor | Officer A |
| Visit type | Routine |
| Planned date | Aug 20, 2026 |
| Actual date | Aug 22, 2026 |
| Status | Approved |
| Findings | 3 |
| Open actions | 2 |
| Next visit | Nov 20, 2026 |
This gives the project team a clear operational record.
The importance of a single site identity
The same site may appear in:
- KoboToolbox,
- ODK,
- DHIS2,
- Excel,
- donor reports,
- project documents,
- and monitoring schedules.
If each system uses a different identity, connecting the information becomes difficult.
A stable internal site record provides a common reference.
For example:
FieldOps Site ID
SITE-1042
External identifiers can then be associated with it.
This allows the organization to maintain one operational identity for the site while still using multiple external systems.
Monitoring data should remain connected to the project
A site may participate in more than one project.
For example:
Kijiji Health Centre
Project A: Maternal Health
Project B: Immunization
Project C: Nutrition
A monitoring visit should therefore identify the relevant project.
Otherwise, findings and monitoring history can become ambiguous.
The same physical location may have different monitoring requirements depending on the project.
Multi-project organizations need project-specific monitoring
Consider an NGO implementing:
Education Program
200 schools.
Health Program
80 facilities.
Water Program
120 community sites.
Each project may have:
- different monitoring frequencies,
- different forms,
- different indicators,
- different staff,
- different findings,
- and different reporting requirements.
A single generic spreadsheet becomes increasingly difficult to maintain.
A structured project-site-visit model allows each project to have its own monitoring workflow while preserving organization-wide visibility.
What happens when monitoring is managed through email?
Email can coordinate individual activities.
It is not a reliable long-term monitoring register.
Consider this sequence:
"Please visit Site A next week."
Then:
"Visit postponed."
Then:
"Visit completed."
Then:
"Please send the report."
Then:
"Report attached."
Six months later, reconstructing the monitoring history from email becomes difficult.
A structured system records the lifecycle directly.
What happens when monitoring is managed through WhatsApp?
WhatsApp can be useful for field coordination.
For example:
"I'm at Site B."
"The visit is complete."
"There is a major issue with stock."
But important operational information should not depend on chat history.
Messages can become difficult to search, easy to overlook and disconnected from the project's formal records.
Communication tools can support field operations.
They should not necessarily become the system of record for monitoring.
A monitoring system should preserve institutional memory
Organizations change.
Projects change.
Staff change.
Funding cycles end.
New teams take over.
Monitoring history should remain available.
A site should retain a record of:
- previous visits,
- findings,
- actions,
- evidence,
- approvals,
- and performance.
This creates institutional memory.
A new M&E officer should not have to ask:
"What happened at this site last year?"
The system should be able to show them.
Where FieldOps fits
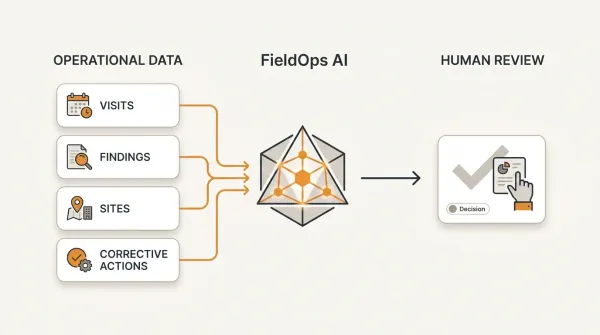
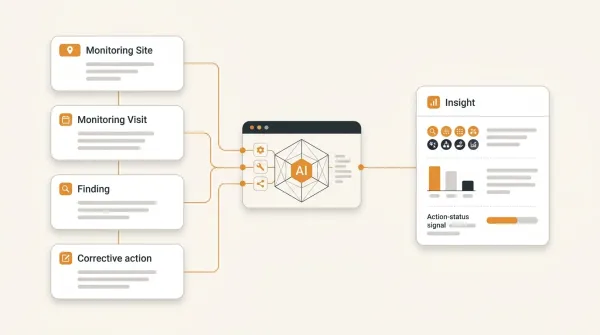
FieldOps is designed around the operational structure of monitoring:
Organization → Program → Project → Site → Visit
A project can contain its sites.
Sites can have monitoring visits.
Visits can have findings.
Findings can generate corrective actions.
Actions can have owners, deadlines, evidence and verification.
This creates a connected monitoring lifecycle rather than a collection of independent form submissions.
FieldOps can also preserve site-level monitoring history so that teams can see previous visits and unresolved issues.
This makes it easier to identify:
- sites that have not been monitored,
- overdue visits,
- recurring findings,
- unresolved actions,
- and monitoring trends.
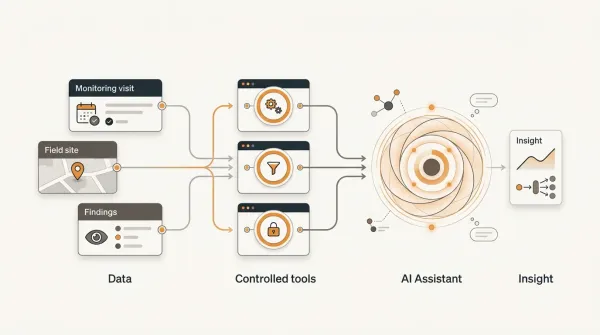
FieldOps does not require replacing KoboToolbox or ODK
Organizations can continue using KoboToolbox or ODK for field data collection where those tools already fit their workflows.
The important distinction is:
Collecting the monitoring data
versus:
Managing the monitoring operation
A field-data collection tool can capture the contents of a visit.
An operational monitoring system needs to manage:
- which sites require visits,
- when visits are due,
- who is responsible,
- whether visits happened,
- what was found,
- what actions were created,
- and whether those actions were resolved.
Both functions can coexist.
FieldOps can also connect monitoring with DHIS2 performance
For health projects, monitoring visits may be combined with routine performance data.
For example:
Site
Facility A
DHIS2 indicator
Immunization coverage
Current performance
68%
Monitoring status
Visited
Monitoring finding
Vaccine stock management issue
Corrective action
Improve stock monitoring
Action status
Open
Now management can see operational context around the performance indicator.
The purpose is not to assume that the finding caused the performance result.
The purpose is to give the team the information needed to investigate and respond.
A complete monitoring workflow
A mature workflow can look like:
1. Define project
↓
2. Add project sites
↓
3. Establish monitoring schedule
↓
4. Assign responsible monitors
↓
5. Schedule visits
↓
6. Conduct field visit
↓
7. Submit monitoring results
↓
8. Review visit
↓
9. Record findings
↓
10. Create corrective actions
↓
11. Track deadlines
↓
12. Verify resolution
↓
13. Plan next visit
This creates continuity from planning through follow-up.
Start simple
Organizations do not need to implement every feature immediately.
A practical starting point is:
Step 1
Create a clean project and site register.
Step 2
Define the expected monitoring frequency.
Step 3
Record planned visits.
Step 4
Record actual visits.
Step 5
Track overdue visits.
Step 6
Connect completed visits to findings.
Step 7
Track corrective actions.
Step 8
Measure monitoring coverage and timeliness.
Step 9
Review recurring findings.
Step 10
Gradually connect performance data.
This creates value without requiring a massive transformation project.
The key questions every M&E manager should be able to answer
At any point in the reporting period, an M&E manager should be able to answer:
How many sites does this project have?
How many sites were supposed to be monitored this period?
How many have actually been monitored?
Which sites are overdue?
How long have they been overdue?
Who is responsible?
Which sites have high-severity findings?
Which corrective actions are overdue?
Which findings are recurring?
Which sites have not been monitored recently?
How does monitoring coverage compare across projects?
Are monitoring gaps concentrated in particular regions or teams?
If answering these questions requires manually merging several spreadsheets, the organization has a workflow problem.
Conclusion
Monitoring a project is not simply a matter of collecting completed forms.
Effective monitoring requires knowing:
Where should we monitor?
When should we monitor?
Who is responsible?
Did the visit happen?
Was it completed on time?
What was found?
What action was required?
Was the action resolved?
When should we return?
That is why a monitoring workflow needs to connect:
Project → Site → Visit → Finding → Action → Follow-up
KoboToolbox and ODK can be excellent tools for collecting field information.
DHIS2 can provide important routine performance information.
Spreadsheets can remain useful for analysis.
But organizations managing many projects and sites need an operational structure that keeps these activities connected.
Monitoring coverage is not just a percentage. It is a record of which sites were seen, which were missed, and what happened afterward.
A strong M&E system makes those answers visible.
It turns monitoring from a collection of completed forms into a continuous operational process.
Key takeaways
-
Monitoring coverage should be traceable to individual project sites.
-
Planned, scheduled, submitted, reviewed, approved and overdue visits are different operational states.
-
A monitoring percentage alone does not explain which sites were missed.
-
Site-level monitoring history is essential for maintaining institutional memory.
-
Monitoring frequency should reflect the project's requirements and, where appropriate, site risk.
-
Overdue visits should show ownership, age and context rather than simply appearing as a red spreadsheet cell.
-
Monitoring coverage and monitoring quality are different measures.
-
A completed visit should remain connected to its findings and corrective actions.
-
Monitoring history can help identify recurring problems and higher-risk sites.
-
A stable site identity makes it easier to connect monitoring information with KoboToolbox, ODK, DHIS2 and other systems.
-
Organizations do not necessarily need to replace existing field-data collection tools to improve monitoring operations.
-
The goal is to create a continuous workflow from planned monitoring through field evidence, findings, corrective actions and follow-up.
Frequently asked questions
How do you track monitoring visits across multiple project sites?
Maintain a structured relationship between projects, sites and monitoring visits. Each planned visit should have a site, expected date, responsible person and status. Completed visits should remain connected to findings and follow-up actions.
How do you calculate monitoring coverage?
A basic monitoring coverage measure can be calculated as completed monitoring visits divided by planned monitoring visits for a defined period, multiplied by 100. Organizations should also examine which sites were missed and whether completed visits were on time.
What is the difference between monitoring coverage and monitoring timeliness?
Monitoring coverage measures whether expected visits occurred. Monitoring timeliness measures whether those visits occurred within the expected timeframe. A project can have high coverage but poor timeliness.
How do you track overdue monitoring visits?
Each planned visit should have an expected date and status. Once the expected date passes without an appropriate completed status, the visit can be classified as overdue and surfaced for follow-up.
Why is site-level monitoring history important?
Site-level history allows M&E teams to see when a site was previously monitored, what was found, which actions remain open and whether problems are recurring.
Can KoboToolbox track monitoring schedules?
KoboToolbox can collect data from monitoring visits, including visit dates and site information. Managing an organization-wide schedule involving planned visits, assignments, overdue monitoring, historical visits and corrective-action workflows may require additional operational tooling.
Can ODK manage monitoring visits?
ODK can be used to collect monitoring data in the field. A separate operational layer may be useful for managing schedules, site assignments, overdue visits, findings and corrective actions across multiple projects and monitoring cycles.
Can monitoring visits be connected to DHIS2 data?
Yes. For health programs, selected DHIS2 indicators can be associated with project sites and monitoring workflows when reliable organisation-unit mappings exist. This allows teams to examine routine performance alongside field monitoring evidence.
How often should project sites be monitored?
There is no universal frequency. Monitoring frequency should depend on project requirements, risk, implementation complexity, reporting requirements and available resources. Some sites may require monthly visits while others may be monitored quarterly or through a risk-based approach.
What is risk-based monitoring?
Risk-based monitoring allocates monitoring resources according to the level of risk or management concern associated with a site or activity. Higher-risk sites may receive more frequent monitoring than lower-risk sites.
What should a monitoring dashboard show?
Useful monitoring metrics can include planned visits, completed visits, monitoring coverage, on-time completion, overdue visits, high-risk sites without recent monitoring, findings, open corrective actions and recurring findings.
Should monitoring visits be tracked in Excel?
Excel can work for small and relatively simple monitoring programs. As the number of projects, sites, staff, visits, findings and corrective actions grows, a structured operational system can reduce the complexity and manual maintenance required by spreadsheets.
How does FieldOps help manage monitoring visits?
FieldOps connects organizations, programs, projects, sites and monitoring visits in a structured workflow. Visits can then be connected to findings and corrective actions, allowing teams to track monitoring activity and follow-up in the same operational context.
Move beyond data collection
FieldOps helps NGOs manage field visits, monitoring templates, findings, corrective actions, dashboards and donor reporting in one operational intelligence platform.
Learn more about FieldOps