How to Stop Managing KoboToolbox Data in Excel: A Practical M&E Workflow for NGOs
KoboToolbox is excellent for collecting field data, but many NGOs still export that data to Excel for cleaning, indicator tracking, findings, and reporting. Learn how to build a more reliable M&E workflow.
KoboToolbox has made digital data collection dramatically easier for NGOs, humanitarian organizations, and development programs. Field teams can collect information offline, synchronize submissions, validate records, and export data for analysis and reporting.
But collecting data digitally does not automatically create a digital monitoring system.
For many organizations, the workflow still looks like this:
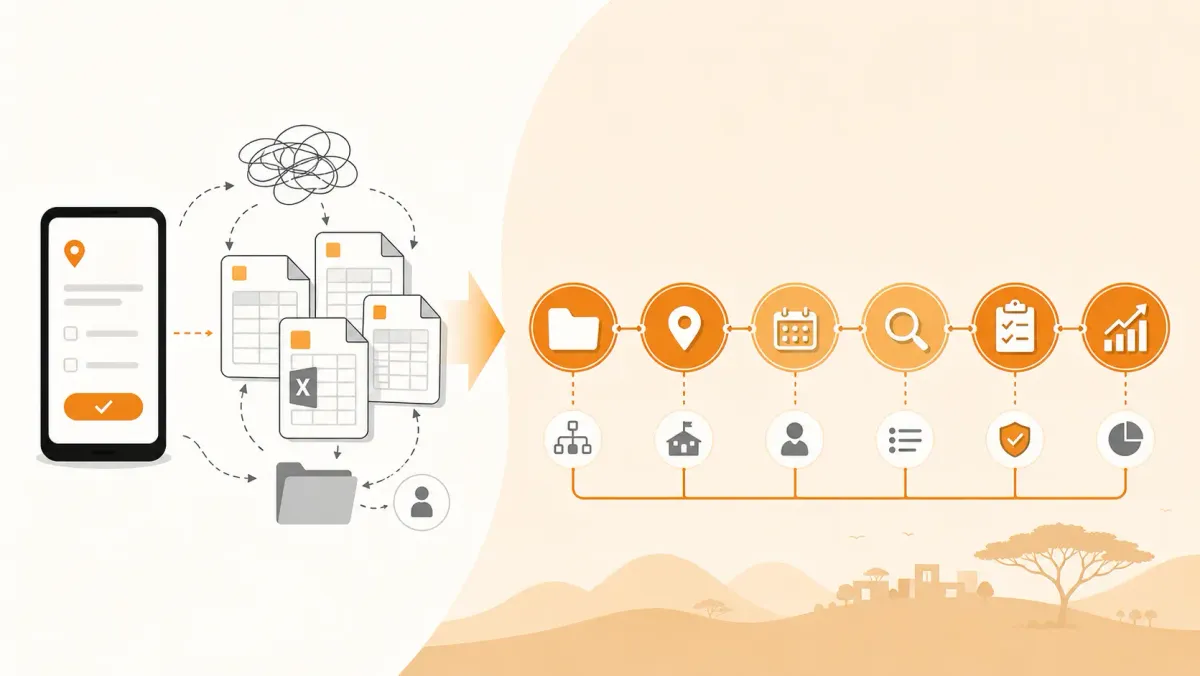
KoboToolbox → Excel → manual cleaning → indicator calculations → charts → PowerPoint → donor report
The data collection process has been modernized, but much of the monitoring and reporting process remains manual.
This creates a familiar problem for M&E teams: the organization has plenty of data, but turning that data into reliable program intelligence still takes too much time.
The solution is not necessarily to replace KoboToolbox. In many cases, KoboToolbox is doing exactly what it should do.
The better approach is to build an operational M&E workflow around the systems already being used for data collection.
The real problem is not KoboToolbox
KoboToolbox is primarily a data collection platform.
That distinction matters.
A field officer might complete a monitoring form containing:
- Project information
- Site information
- Activities implemented
- Beneficiaries reached
- Indicator values
- Observations
- Findings
- Recommendations
- Photos and other evidence
Once the form is submitted, however, the organization still has to answer a different set of questions:
- Which project does this submission belong to?
- Which site was visited?
- Which monitoring visit does it represent?
- Which indicators are on target?
- Which indicators are below target?
- What findings were identified?
- Who is responsible for addressing those findings?
- Which corrective actions are overdue?
- What changed compared with the previous reporting period?
- Which projects require management attention?
- What evidence should be included in the donor report?
Those are monitoring and management questions, not simply data collection questions.
This distinction is important because many organizations solve the first problem — digital data collection — while continuing to solve the second problem using spreadsheets, email, PowerPoint and manually maintained trackers.
The typical KoboToolbox-to-Excel workflow
Consider a development organization implementing a nutrition program across 40 health facilities.
Field officers conduct monthly monitoring visits using KoboToolbox.
Each visit produces a digital submission.
At first, the process works well.
The M&E officer downloads the data into Excel and prepares a monthly report.
Everything seems manageable.
Month 1
There are 40 facilities and 40 monitoring submissions.
The M&E officer downloads the data, checks it and prepares the report.
The workflow is simple.
Month 6
There are now hundreds of submissions.
The M&E team has accumulated:
- Several Excel files
- Multiple reporting periods
- Different versions of indicator calculations
- Separate lists of facilities
- Monitoring findings
- Corrective action trackers
- Charts prepared for management
- PowerPoint presentations
- Previous donor reports
The original KoboToolbox data still exists.
But the operational picture is increasingly distributed across multiple files.
Month 12
Management asks:
Which facilities have repeatedly failed to meet the indicator target during the last six months?
The answer may exist somewhere in the organization's data.
But producing it may require:
- Exporting KoboToolbox data.
- Cleaning the records.
- Matching facility names.
- Combining reporting periods.
- Checking indicator definitions.
- Recalculating performance.
- Reviewing previous findings.
- Checking the corrective-action tracker.
- Creating a new spreadsheet.
- Preparing a management summary.
The organization has data.
What it lacks is a reliable operational workflow for turning that data into decisions.
Why Excel becomes difficult at scale
Excel is not inherently a bad tool.
It is extremely useful for analysis, ad-hoc calculations, data exploration and one-off reporting tasks.
The problem occurs when Excel gradually becomes the organization's monitoring system of record.
This usually happens because Excel is easy to start with.
A team creates:
M&E_Tracker.xlsx
Then another person creates:
M&E_Tracker_Final.xlsx
Then:
M&E_Tracker_Final_v2.xlsx
Eventually:
M&E_Tracker_Final_v2_UPDATED_USE_THIS_ONE.xlsx
The filenames are humorous, but the underlying problem is serious.
A spreadsheet can tell you what was entered into it.
It does not automatically provide organizational control over:
- who owns a finding,
- which project a visit belongs to,
- whether a site was actually visited,
- which version of an indicator definition was used,
- whether an action has been completed,
- whether a finding has been verified,
- or which projects require attention.
Those relationships need to be deliberately modeled.
Five problems created by a spreadsheet-dependent M&E workflow
1. Data collection and monitoring become disconnected
KoboToolbox may know that a form submission occurred.
The M&E team may know that the submission relates to a particular project.
But if the connection between the submission, project, site, visit and indicator is maintained manually, the organization has created another layer of administrative work.
A mature monitoring system should understand relationships such as:
Organization → Program → Project → Site → Monitoring Visit → Monitoring Responses → Findings → Corrective Actions
That structure allows an organization to move from individual records to operational understanding.
2. Findings become separate from the data that generated them
Suppose a monitoring officer discovers that a health facility has insufficient stock of essential supplies.
The KoboToolbox form captures the observation.
But what happens next?
In many organizations, the finding is copied into an Excel tracker.
Someone emails the facility manager.
The issue is discussed in a meeting.
A recommendation is included in a report.
Three months later, someone asks:
Was this issue resolved?
Now the team has to search through spreadsheets, emails or meeting notes.
A better workflow treats the finding as a first-class monitoring record.
A finding should be connected to:
- The project
- The site
- The monitoring visit
- The relevant indicator or monitoring area
- Severity
- Responsible person
- Required action
- Due date
- Status
- Resolution evidence
- Verification
That changes monitoring from recording problems to managing problems.
3. Indicator tracking becomes fragile
An M&E team may have dozens or hundreds of indicators.
For example:
| Indicator | Target | Actual | Status |
|---|---|---|---|
| Children receiving nutrition services | 5,000 | 4,620 | Below target |
| Facilities submitting reports on time | 95% | 91% | Below target |
| Facilities meeting stock requirements | 90% | 94% | On target |
The table looks straightforward.
But the underlying calculations become difficult when:
- indicators are collected through different forms,
- reporting periods differ,
- projects use different targets,
- sites have different denominators,
- indicator definitions change,
- data comes from several systems,
- calculations are maintained in separate spreadsheets.
The challenge is therefore not simply calculating a percentage.
The challenge is maintaining a consistent relationship between:
indicator → project → site → reporting period → target → actual → performance.
4. Reporting becomes repetitive
Many M&E professionals spend significant time doing work that has little analytical value:
- downloading data,
- renaming files,
- copying columns,
- removing duplicates,
- matching site names,
- checking formulas,
- updating charts,
- copying charts into PowerPoint,
- updating narrative reports,
- preparing another version for management,
- preparing another version for the donor.
The same underlying information may be transformed repeatedly for different audiences.
This is a sign that the organization has a reporting workflow problem, not necessarily a data collection problem.
A better system captures monitoring information once and allows different reports and views to be generated from the same underlying records.
5. Management sees the report too late
This is perhaps the most important problem.
Consider a monitoring visit conducted on March 5.
The data is collected in KoboToolbox.
The M&E officer downloads the data on March 10.
The data is cleaned on March 12.
The analysis is completed on March 15.
The report is prepared on March 18.
Management reviews it on March 20.
By the time the organization identifies a serious problem, two weeks or more may have passed.
Digital data collection has improved the speed of capturing information.
But if the rest of the workflow remains manual, the organization may still have slow decision-making.
What a better M&E workflow looks like
A more mature workflow separates the responsibilities of different systems.
For example:
Field Data Collection
↓
KoboToolbox / ODK
↓
Data Integration
↓
Project / Site / Visit Mapping
↓
Monitoring Workflow
↓
Indicator Performance
↓
Findings
↓
Corrective Actions
↓
Management Insight
↓
Reports / Dashboards / Donor Reporting
This approach does not require an organization to abandon its existing data collection tools.
Instead, each system does what it is best suited to do.
Where KoboToolbox fits
KoboToolbox is particularly useful for collecting structured field information.
A monitoring form can capture:
- observations,
- quantitative measurements,
- indicator values,
- GPS coordinates,
- photos,
- beneficiary information,
- facility information,
- qualitative responses,
- and other field-level evidence.
KoboToolbox also provides mechanisms for exporting or connecting collected data to external analysis and reporting tools.
That makes it a useful component of an M&E architecture.
The mistake is assuming that the existence of digital data collection means the entire monitoring process has been digitized.
It has not.
Digital data collection is one component of digital M&E.
Where Excel still fits
The answer is not to eliminate Excel.
Excel remains valuable for:
- exploratory analysis,
- ad-hoc calculations,
- data review,
- one-off analysis,
- custom modelling,
- and situations where a structured system is unnecessary.
The problem is using Excel as the permanent system for relationships and workflows that should be managed operationally.
A useful rule is:
Use spreadsheets for analysis when appropriate; don't make spreadsheets responsible for managing your entire monitoring operation.
A practical architecture for NGOs
An NGO using KoboToolbox can build a more robust architecture by separating five layers.
Layer 1: Data collection
Use KoboToolbox or ODK to collect information from the field.
The priority here is reliable, structured data capture.
Layer 2: Data integration
Bring information from relevant sources into a common operational structure.
Possible sources include:
- KoboToolbox
- ODK Central
- DHIS2
- Excel
- CSV files
- APIs
- manually entered monitoring information
The goal is not necessarily to put every record into one giant database.
The goal is to establish reliable relationships between the data and the program being monitored.
Layer 3: Operational monitoring
This is where the organization answers:
- What project does this belong to?
- What site does this relate to?
- When was the site visited?
- What indicators were assessed?
- What was found?
- What requires action?
This is the layer most often missing from a collection-first workflow.
Layer 4: Performance management
Once monitoring information is structured, organizations can answer questions such as:
- Which indicators are below target?
- Which sites have recurring problems?
- Which projects require attention?
- Which findings remain unresolved?
- Which corrective actions are overdue?
- How has performance changed over time?
This is where data becomes operational intelligence.
Layer 5: Reporting
Finally, the same underlying information can support:
- project reports,
- management dashboards,
- M&E reports,
- donor reports,
- performance summaries,
- site-level reviews,
- and program-level analysis.
The important principle is:
Don't rebuild the data for every report. Build the monitoring system once and report from it.
A worked example
Imagine an organization implementing an agricultural resilience program across 25 sites.
Each month, field officers collect monitoring data through KoboToolbox.
The form records:
- farmer groups visited,
- training sessions conducted,
- farmers reached,
- demonstration plots inspected,
- input availability,
- adoption indicators,
- observations,
- photos,
- and findings.
The traditional workflow might be:
Kobo → Excel export → Cleaning → Indicator calculations → Charts → PowerPoint → Donor report
A stronger operational workflow would be:
Kobo → Project and site mapping → Monitoring visit → Indicator results → Performance assessment → Findings → Corrective actions → Management dashboard → Donor reporting
Now suppose Site 14 has failed to meet an input-availability indicator for three consecutive months.
In the first workflow, discovering this may require manually comparing several spreadsheets.
In the second workflow, the system can identify Site 14 as a recurring performance concern.
The difference isn't simply better visualization.
The difference is that the monitoring data has been connected to the operational structure of the program.
Where FieldOps fits
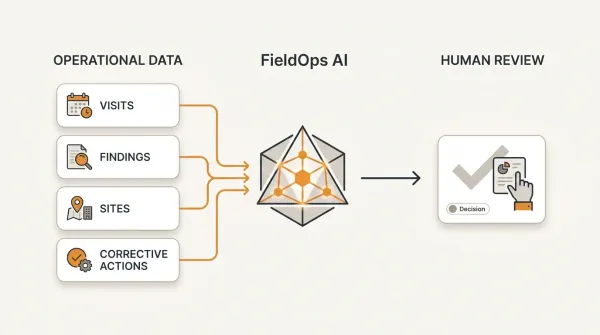
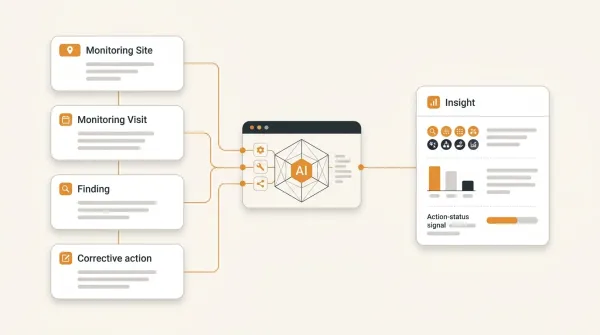
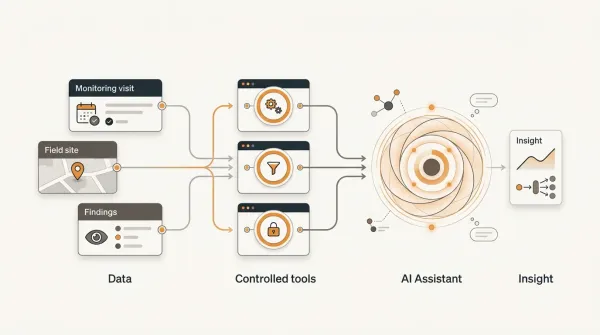
FieldOps is designed for the layer between field data collection and program decision-making.
Organizations can continue using tools such as KoboToolbox, ODK and DHIS2 where those systems make sense.
FieldOps provides the operational structure around the monitoring process:
Organization → Program → Project → Site → Visit → Responses → Findings → Actions → Performance → Reports
This means a field submission does not have to remain an isolated data record.
It can become part of the organization's broader monitoring workflow.
For example, organizations can use FieldOps to:
- organize projects and sites,
- configure monitoring templates,
- conduct and manage monitoring visits,
- capture monitoring responses,
- track findings,
- assign corrective actions,
- monitor performance,
- integrate external data sources,
- and generate reporting outputs.
The objective is not to replace every tool in an organization's technology stack.
It is to connect the information those tools produce to the operational work of monitoring programs.
KoboToolbox and FieldOps are not necessarily competitors
This distinction is important.
A common misconception is that an organization must choose between its data collection platform and its monitoring system.
It doesn't necessarily have to.
A practical architecture might look like this:
| Need | Example system |
|---|---|
| Field data collection | KoboToolbox / ODK |
| Routine health information | DHIS2 |
| Operational monitoring | FieldOps |
| Advanced analysis | Excel / Power BI / other BI tools |
| Donor reporting | FieldOps + existing reporting tools |
The exact architecture depends on the organization.
The important principle is that data collection, operational monitoring and analytics are different jobs.
Trying to force one tool to perform every job can create unnecessary complexity.
When should an NGO consider moving beyond spreadsheets?
A spreadsheet may be sufficient when:
- there are few projects,
- few sites are involved,
- one person maintains the data,
- reporting is infrequent,
- and there are few workflow dependencies.
The need for a dedicated monitoring system becomes stronger when:
- multiple projects share the same organization,
- many sites are being monitored,
- several staff members update monitoring information,
- findings require follow-up,
- indicators need consistent tracking,
- management needs current performance information,
- multiple data sources are involved,
- donor reporting is repetitive,
- or the organization cannot easily determine which actions remain unresolved.
The question is therefore not:
"How many rows are in our spreadsheet?"
A better question is:
"How much operational work are we asking our spreadsheets to manage?"
A practical transition plan
An NGO does not need to replace its entire M&E architecture overnight.
A practical transition can happen in stages.
Step 1: Map the current workflow
Document:
Where is data collected?
↓
Where is it stored?
↓
Who cleans it?
↓
Who calculates indicators?
↓
Where are findings recorded?
↓
Where are actions tracked?
↓
How are reports produced?
This often reveals that the organization has several disconnected processes.
Step 2: Identify the system of record
Decide which system should be authoritative for each type of information.
For example:
- KoboToolbox → field submissions
- DHIS2 → routine health data
- FieldOps → operational monitoring
- BI platform → advanced analytics
Avoid maintaining the same information manually in multiple places.
Step 3: Standardize project and site structures
This is often overlooked.
A site might be called:
Kapsabet HC
in one system,
Kapsabet Health Centre
in another,
and:
Kapsabet HC - 01
in Excel.
Reliable monitoring requires consistent identifiers.
Step 4: Connect monitoring data to operational entities
Every monitoring record should ideally be traceable to:
- an organization,
- program,
- project,
- site,
- visit,
- reporting period,
- indicator,
- finding,
- or action where applicable.
This turns individual records into an operational history.
Step 5: Automate repetitive reporting
Once the underlying information is structured, automate the parts of reporting that are repetitive.
The M&E team should spend more time asking:
Why is this indicator below target?
and less time asking:
Which spreadsheet contains the latest numbers?
The ultimate goal: move from data collection to data use
The purpose of an M&E system is not to accumulate records.
It is to help an organization understand what is happening in its programs and act on that information.
A mature monitoring workflow should allow an organization to move through this chain:
Collect → Validate → Organize → Analyze → Identify → Act → Follow up → Report
If KoboToolbox handles collection well but the organization still relies on multiple spreadsheets, emails and manual reports for the remaining steps, the organization has digitized only part of its M&E process.
That is why the next stage of digital M&E is not necessarily another data collection form.
It is an operational monitoring layer that connects data to projects, sites, visits, indicators, findings, actions and decisions.
Key takeaways
-
KoboToolbox is a powerful data collection tool, but digital data collection is not the same as a complete M&E system.
-
Excel remains useful for analysis, but becomes problematic when it is used as the permanent system for managing monitoring relationships, workflows and corrective actions.
-
Monitoring data becomes more useful when it is connected to programs, projects, sites, visits, indicators and reporting periods.
-
Findings should not disappear into separate spreadsheets or emails. They should be tracked through to corrective action and resolution.
-
Organizations using KoboToolbox, ODK or DHIS2 do not necessarily need to replace those systems. They may need an operational layer around them.
-
The objective of modern M&E is not simply to collect more data. It is to reduce the distance between collecting information and acting on it.
Frequently asked questions
Is KoboToolbox enough for M&E?
KoboToolbox can support important parts of an M&E workflow, particularly digital field data collection and reporting. Whether it is sufficient depends on the organization's monitoring requirements. Organizations with multiple projects, sites, indicators, findings and follow-up workflows may need additional operational systems.
Should NGOs stop using Excel for M&E?
No. Excel remains valuable for analysis and ad-hoc work. The issue is using Excel as the primary system for managing complex monitoring relationships, workflows and corrective actions.
Can KoboToolbox and an M&E management system be used together?
Yes. A data collection platform and an operational M&E system can perform complementary roles. KoboToolbox can collect field information while an operational monitoring platform can organize that information around projects, sites, visits, indicators, findings and actions.
What is the difference between data collection and M&E?
Data collection is the process of gathering information. M&E includes the broader process of defining indicators, collecting and validating evidence, assessing performance, identifying findings, following up actions, learning from results and reporting to stakeholders.
When should an NGO move from spreadsheets to an M&E system?
There is no universal row-count threshold. The need usually becomes apparent when multiple people, projects, sites, reporting periods, indicators or corrective actions must be managed consistently and the organization begins spending substantial time reconciling spreadsheets and manually preparing reports.
Can FieldOps replace KoboToolbox?
FieldOps does not need to replace KoboToolbox. Its purpose is to provide an operational monitoring layer that can work alongside existing data collection and information systems. Organizations can use the tools that are appropriate for their particular workflows.
Move beyond data collection
FieldOps helps NGOs manage field visits, monitoring templates, findings, corrective actions, dashboards and donor reporting in one operational intelligence platform.
Learn more about FieldOps