How to Turn M&E Data Into Actionable Insights
Collecting monitoring data is only the beginning. Learn how M&E teams can turn project data into actionable insights, decisions and follow-up actions.
Most organizations do not have a data shortage.
They have a data-to-action problem.
A project may collect thousands of monitoring responses every month.
Field officers submit KoboToolbox or ODK forms.
Routine indicators are reported through systems such as DHIS2.
M&E teams maintain Excel trackers.
Project managers receive monitoring reports.
Dashboards display indicators.
Yet, after all that work, management may still ask:
"What do we need to do?"
That question exposes one of the biggest weaknesses in many M&E systems.
The organization is collecting information.
It may even be analyzing that information.
But the information is not consistently being converted into:
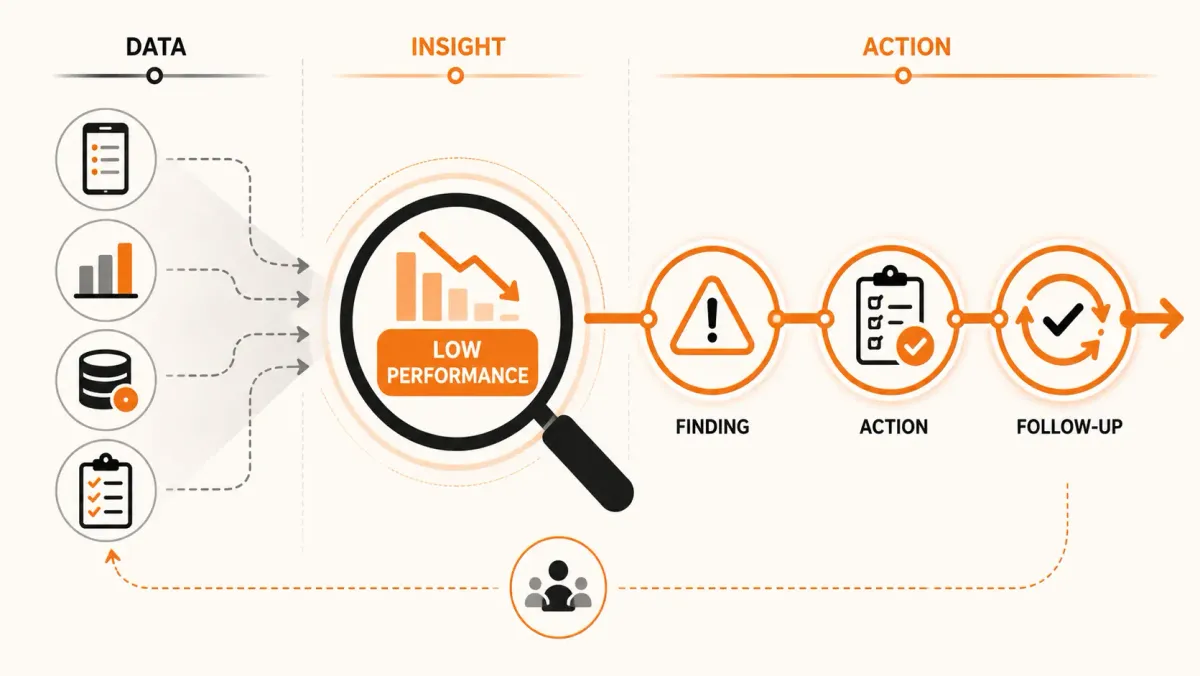
Insight → Decision → Action → Follow-up
This distinction matters.
A monitoring report can tell you what happened.
An effective M&E process should also help the organization determine:
- what requires attention,
- where the problem is occurring,
- how serious it is,
- who should respond,
- what action is required,
- when that action is due,
- and whether the situation improved.
That is the difference between reporting data and using data operationally.
Data is not the same as insight
Consider a project monitoring report containing this information:
| Indicator | Target | Actual |
|---|---|---|
| Households reached | 10,000 | 8,200 |
| Training completion | 90% | 72% |
| Referral completion | 85% | 61% |
These are useful numbers.
But they are not yet an action plan.
The project manager still needs to ask:
Why is referral completion only 61%?
Which sites are responsible for most of the gap?
Is the problem concentrated in a particular region?
Has the problem occurred before?
What did the latest monitoring visits find?
Is there already a corrective action?
Who is responsible for resolving it?
The numbers become more useful when they lead to those questions.
The M&E data-to-action cycle
A practical M&E workflow can be represented as:
Collect
↓
Validate
↓
Analyze
↓
Identify a signal
↓
Investigate
↓
Record a finding
↓
Create an action
↓
Assign responsibility
↓
Follow up
↓
Measure the result
This is more useful than treating the M&E process as:
Collect → Report
The report is not the end of the process.
It should be a trigger for better decisions.
Step 1: Start with the decision
One of the most effective ways to improve M&E is to begin with the decision the organization needs to make.
Instead of asking:
What data can we collect?
Ask:
What decision will this data help us make?
For example:
Decision
Which project sites need additional support this month?
The data required might include:
- recent performance,
- monitoring status,
- open findings,
- overdue corrective actions,
- recent changes in performance,
- and site risk.
That is much more focused than collecting every possible data point.
Step 2: Define the signal
A signal is an observation that deserves attention.
Examples include:
- performance below target,
- sudden decline,
- repeated finding,
- overdue action,
- missing reporting,
- unusual variation,
- monitoring gap,
- or persistent data-quality problem.
For example:
Target: 90%
Current performance: 61%
That is a signal.
But the signal does not automatically explain the cause.
It tells the M&E team:
Something requires investigation.
Step 3: Move from the portfolio to the site
Organization-level averages can hide important problems.
Suppose a project has 100 sites.
Overall performance is:
87%
That sounds reasonably strong.
But suppose the underlying data looks like this:
| Site | Performance |
|---|---|
| Site A | 98% |
| Site B | 96% |
| Site C | 95% |
| Site D | 93% |
| Site E | 42% |
The project average does not tell the whole story.
Site E may require immediate attention.
This is why operational M&E should allow teams to move from:
Organization
to:
Program
to:
Project
to:
Site
to:
Specific issue
The more actionable the question becomes, the more important site-level context becomes.
Step 4: Investigate the signal
A performance problem is not automatically a finding.
Suppose a site reports:
Coverage = 61%
The M&E team should investigate.
Possible explanations could include:
- stock availability,
- staffing shortages,
- service interruptions,
- reporting problems,
- data-quality issues,
- changes in the target population,
- implementation delays,
- or other contextual factors.
Monitoring evidence can help provide that context.
For example:
Routine performance
↓
Low coverage
↓
Monitoring visit
↓
Stock management problem identified
Now the organization has more information.
But it should still avoid assuming that the finding automatically caused the performance result.
The purpose of investigation is to improve understanding.
Step 5: Turn observations into structured findings
Once an issue has been investigated, it should be recorded in a structured way.
A useful finding can include:
Finding
Incomplete referral documentation.
Site
Kijiji Health Centre.
Project
Maternal Health Improvement.
Severity
Medium.
Date identified
August 12, 2026.
Source
Monitoring visit.
Evidence
Supporting documentation.
This is more useful than writing:
"Documentation needs improvement."
in a long narrative report.
Structured findings can be searched, filtered, counted and followed up.
Step 6: Separate findings from actions
A finding describes a problem or observation.
An action describes what should be done about it.
For example:
Finding
Referral documentation is incomplete.
Corrective action
Review referral documentation procedures and ensure all referral records are completed.
These are related but different objects.
The finding explains:
What is wrong?
The action explains:
What needs to happen?
Keeping those concepts separate creates a clearer workflow.
Step 7: Assign ownership
An action without an owner is only a recommendation.
Consider:
"Improve documentation."
Who is responsible?
The facility manager?
The project officer?
The M&E officer?
The county coordinator?
A useful action record should have an accountable owner.
For example:
Action owner
Facility Manager.
Due date
September 10, 2026.
Status
Open.
Now the recommendation becomes an operational task.
Step 8: Give every action a deadline
Without a deadline, corrective actions can remain open indefinitely.
Compare:
Improve stock management.
with:
Complete stock reconciliation and submit evidence by September 10.
The second statement is measurable.
A useful corrective action can therefore include:
- action,
- owner,
- due date,
- status,
- evidence,
- verification.
Step 9: Track action status
Corrective actions should have a lifecycle.
For example:
Open
↓
In progress
↓
Submitted for verification
↓
Verified
↓
Closed
There may also be a state such as:
Overdue
when the deadline passes without completion.
This makes management visibility much stronger.
A project manager can quickly distinguish:
20 open actions
from:
5 overdue actions
from:
3 awaiting verification
Those categories require different responses.
Step 10: Close the loop
The M&E process is incomplete if the organization never checks whether the action worked.
Suppose a monitoring visit identifies:
Finding
Low-quality beneficiary records.
The project creates:
Action
Retrain field staff and review beneficiary records.
The action is completed.
But the next monitoring cycle shows:
The same problem remains.
The action was completed.
The problem was not solved.
This is why:
Action completion
is not necessarily the same as:
Problem resolution
The organization needs follow-up.
Action completion versus outcome improvement
This distinction is important.
Suppose:
Action
Conduct staff training.
Status
Completed.
That tells us the training happened.
It does not tell us whether:
- staff knowledge improved,
- data quality improved,
- reporting errors decreased,
- or project performance improved.
A mature M&E workflow therefore asks:
Did we complete the action?
and then:
Did the situation improve?
These are different questions.
Step 11: Compare performance before and after action
Suppose a site has:
Before intervention
Performance: 61%
Action
Improve referral procedures.
After intervention
Performance: 78%
That is useful evidence.
It still does not automatically prove that the action caused the improvement.
Other factors may have changed.
But the sequence gives the project team something meaningful to investigate.
The operational history becomes:
Performance
↓
Finding
↓
Action
↓
Follow-up
↓
New performance
That is far more informative than a series of disconnected reports.
Why narrative reports are often not enough
A traditional monitoring report might contain:
"The team observed weaknesses in documentation at several sites. Staff were advised to improve record keeping."
This may be useful as narrative.
But operationally, several questions remain unanswered:
- Which sites?
- Which findings?
- How severe?
- What action?
- Who owns the action?
- When is it due?
- Is it complete?
- Was it verified?
- Did the problem recur?
A structured workflow turns narrative observations into manageable records.
The problem with "recommendations" that live only in reports
Many monitoring reports contain recommendations.
For example:
Recommendations
- Improve stock management.
- Strengthen supervision.
- Improve data quality.
- Conduct refresher training.
The report may be approved and archived.
Six months later, another monitoring team may discover the same problems.
Why?
Because the recommendations were never converted into an operational follow-up process.
A recommendation should be able to become:
Finding → Action → Owner → Deadline → Evidence → Verification
Use data to prioritize, not just describe
Not every problem deserves the same level of attention.
Suppose a project identifies 50 findings.
They may include:
- 20 low-severity issues,
- 20 medium-severity issues,
- 8 high-severity issues,
- 2 critical issues.
Management should not have to read all 50 findings to determine priorities.
Structured severity allows teams to prioritize.
For example:
Critical
Immediate management attention.
High
Urgent corrective action.
Medium
Routine follow-up.
Low
Monitor and address through normal processes.
The exact categories should reflect the organization's own risk framework.
Combine multiple signals
A single metric can be misleading.
Consider Site A:
Performance: 88%
Open findings: 0
Monitoring: Current
This site may require little immediate attention.
Now consider Site B:
Performance: 76%
Open high-severity findings: 3
Corrective actions overdue: 2
Last monitoring visit: 5 months ago
Site B presents a very different operational picture.
The strongest prioritization often comes from combining signals rather than looking at one indicator.
Create an attention model
Organizations can define rules such as:
Flag sites where performance is below target and a high-severity finding remains open.
Or:
Flag sites where monitoring is overdue and corrective actions are also overdue.
Or:
Flag sites where the same finding has appeared in three consecutive visits.
These rules convert data into an operational queue.
Instead of asking:
"What should we look at?"
the manager can see:
"These 12 sites require attention."
Example: identifying sites that need intervention
Suppose a project has:
80 sites
The system identifies:
12 sites
with one or more of the following:
- performance below target,
- overdue monitoring,
- high-severity findings,
- overdue corrective actions,
- recurring findings.
The M&E manager can then prioritize those sites for review.
This is more useful than reviewing 80 site records equally.
Use trends instead of isolated values
A single performance value can be misleading.
Consider:
January: 78%
February: 80%
March: 82%
April: 84%
The trend is improving.
Now consider:
January: 91%
February: 88%
March: 80%
April: 72%
The current value may still look acceptable in isolation.
The trend tells a different story.
M&E systems should therefore help teams examine:
Current performance
and:
Performance over time
Sudden changes deserve investigation
Suppose a site normally reports:
85–90%
Then suddenly reports:
52%
That does not automatically mean implementation has collapsed.
The change could be caused by:
- a genuine performance problem,
- a reporting change,
- data-quality problems,
- a denominator change,
- a service disruption,
- or another contextual factor.
The correct response is not immediately:
"Performance is bad."
It is:
"This change requires investigation."
This distinction helps prevent poor management decisions based on unexplained data anomalies.
M&E teams need context around the numbers
A dashboard might show:
Performance: 62%
But the number alone does not explain why.
Useful context might include:
Last monitoring visit
August 12.
Findings
High severity
Open actions
Overdue actions
Previous performance
74%.
Now the number has operational context.
This is where integrated monitoring information becomes powerful.
Use monitoring data to ask better questions
Good M&E does not always provide immediate answers.
Sometimes it produces better questions.
For example:
Why did performance decline?
Is the decline concentrated in certain sites?
Did those sites have recent monitoring visits?
What findings were identified?
Were corrective actions implemented?
Did performance change afterward?
Is the problem recurring?
These questions lead to investigation and learning.
Do not confuse data visualization with decision support
A beautiful dashboard can still be operationally weak.
A dashboard might show:
- 20 KPIs,
- 12 charts,
- 5 maps,
- 10 filters.
But if a project manager cannot determine:
What requires action?
then the dashboard has not fully solved the management problem.
Decision support should reduce the distance between:
Information
and:
Action
A useful M&E management view
Instead of displaying only indicators, consider a view such as:
Sites requiring attention
12
Overdue monitoring visits
7
High-severity open findings
9
Overdue corrective actions
14
Sites with declining performance
8
The manager can then drill into the underlying sites.
This turns reporting into prioritization.
Drill-down matters
Suppose management sees:
Overdue corrective actions: 14
The next question is:
Which ones?
The system should allow the manager to move from:
14 overdue actions
↓
Project
↓
Site
↓
Finding
↓
Action
↓
Owner
↓
Due date
That is an operational workflow.
Without drill-down, the metric is mainly descriptive.
The same principle applies to performance
Suppose:
Project performance = 76%
Management should be able to ask:
Which sites are pulling performance down?
The answer might identify:
Site A — 92%
Site B — 88%
Site C — 81%
Site D — 48%
Now the team knows where to investigate.
Connect data collection to action management
A field data collection form may capture:
- observations,
- responses,
- measurements,
- photographs,
- GPS coordinates,
- and comments.
Those are important.
But the operational workflow should continue after submission.
For example:
Field visit
↓
Observation
↓
Finding
↓
Corrective action
↓
Owner
↓
Deadline
↓
Verification
↓
Closure
This is where the collected data becomes operational.
What KoboToolbox and ODK solve — and what they do not automatically solve
KoboToolbox and ODK are widely used for digital field data collection.
They can help organizations collect structured information from the field.
But collecting a response does not automatically answer:
Who should act on this finding?
or:
When is the action due?
or:
Is the action overdue?
or:
Did the same issue recur during the next visit?
Those questions belong to the operational follow-up layer.
This distinction is important.
Data collection is one part of M&E.
Action management is another.
Organizations may need both.
What DHIS2 solves — and what it does not automatically solve
DHIS2 can provide important routine performance information, particularly in health programs.
But a performance indicator such as:
Immunization coverage = 64%
does not automatically tell a project manager:
- what happened at the facility,
- what the latest monitoring visit found,
- whether there are open corrective actions,
- who owns those actions,
- or when the next follow-up should occur.
Performance information becomes more actionable when it can be considered alongside operational context.
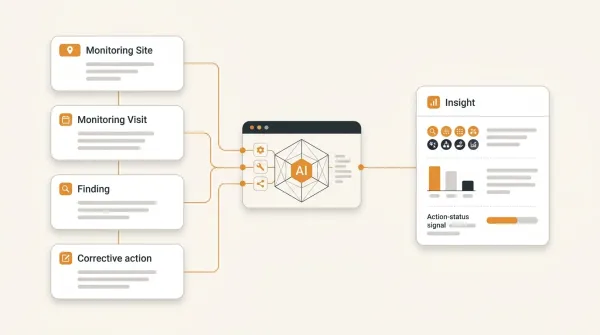
The role of an operational M&E layer
An operational M&E layer can connect:
Projects
Sites
Visits
Findings
Actions
Performance
This creates a common structure around the work teams actually manage.
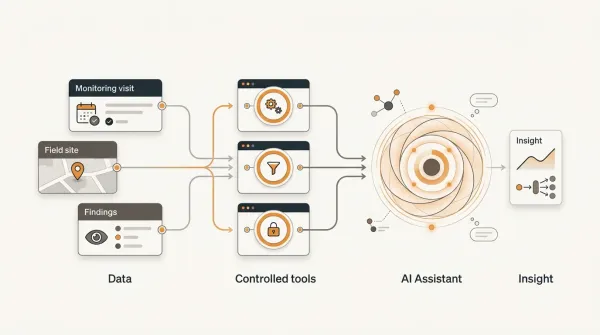
The objective is not necessarily to replace the organization's existing systems.
It is to make their information useful in the operational workflow.
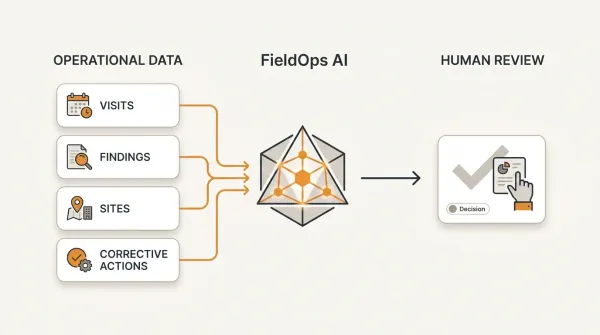
How FieldOps turns M&E information into operational work
FieldOps is designed around the relationship between:
Project
↓
Site
↓
Visit
↓
Finding
↓
Action
↓
Follow-up
This structure allows monitoring information to become part of an operational process.
For example:
A project site records poor performance.
↓
The M&E team investigates.
↓
A monitoring visit identifies a problem.
↓
The issue becomes a structured finding.
↓
A corrective action is created.
↓
An owner and deadline are assigned.
↓
The action is followed up.
↓
Evidence can be reviewed.
↓
The finding can be closed or reopened.
↓
The next monitoring cycle can determine whether the problem has recurred.
This creates continuity.
FieldOps does not replace your data collection tools
Organizations may already have established workflows in:
- KoboToolbox,
- ODK,
- DHIS2,
- spreadsheets,
- or other systems.
Replacing all of those systems may not be necessary.
The more practical approach can be to preserve the systems that already work for their intended purpose while creating a structured operational workflow around project monitoring.
For example:
KoboToolbox
Collect field information.
↓
FieldOps
Manage project sites, visits, findings and actions.
↓
DHIS2
Provide relevant routine performance information.
↓
FieldOps
Connect selected performance information to project-site context.
This creates a complementary ecosystem.
A practical example
Consider a health project supporting 60 facilities.
The organization collects routine performance data through DHIS2.
M&E officers conduct quarterly monitoring visits using KoboToolbox.
During one reporting period, the data shows:
Facility A
Performance: 91%
Open findings: 0
Monitoring: Current
Facility B
Performance: 82%
Open findings: 1
Monitoring: Current
Facility C
Performance: 59%
Open findings: 4
Monitoring: Overdue
Facility C clearly deserves further investigation.
The M&E manager can review:
- the performance trend,
- the latest monitoring history,
- previous findings,
- open actions,
- and the date of the last visit.
The manager might discover that the same operational problem has appeared during several previous visits.
That creates a much stronger basis for intervention.
Recurring problems are especially important
Suppose the same finding appears at a site in:
January
April
July
The problem is recurring.
That should trigger a different management response from a one-time observation.
The organization may need to ask:
Why have previous actions not resolved the problem?
Possible explanations include:
- the action was inappropriate,
- the action was not implemented,
- responsibility was unclear,
- the deadline was unrealistic,
- the underlying cause was misunderstood,
- or the issue requires a broader intervention.
Recurring findings therefore provide valuable learning signals.
From corrective action to organizational learning
The ultimate goal is not to create more action items.
It is to improve implementation.
If the same issue appears repeatedly across 20 sites, the organization may have a systemic problem.
For example:
20 sites
15 report the same documentation problem
This may indicate that the organization should address the issue centrally rather than treating every site independently.
Possible responses could include:
- revising guidance,
- improving training,
- changing a process,
- simplifying documentation,
- strengthening supervision,
- or improving the data collection workflow.
This is where site-level M&E information can reveal organization-wide patterns.
Turn repeated findings into systemic insight
Consider:
Site A
Documentation problem.
Site B
Documentation problem.
Site C
Documentation problem.
Site D
Documentation problem.
After aggregating findings, the organization discovers:
35% of monitored sites have the same documentation problem.
That is no longer just a collection of site-level findings.
It is a program-level signal.
The organization can now investigate whether there is a common underlying cause.
Data should support the management cycle
A useful management cycle is:
Plan
↓
Implement
↓
Monitor
↓
Analyze
↓
Act
↓
Follow up
↓
Learn
↓
Adapt
M&E becomes more valuable when it is embedded throughout this cycle.
If M&E stops at:
Analyze → Report
the organization loses much of the potential value of its data.
A practical framework for actionable M&E
Organizations can use a simple seven-question framework.
1. What happened?
Identify the data signal.
2. Where did it happen?
Identify the project, region or site.
3. How significant is it?
Assess magnitude, severity or risk.
4. Why might it be happening?
Investigate using monitoring evidence and contextual information.
5. What should happen next?
Define the required action.
6. Who is responsible?
Assign an owner and deadline.
7. Did it work?
Follow up and compare the outcome.
If the M&E workflow can answer all seven questions, the data is much more likely to support action.
Avoid turning every data point into an action
Not every indicator movement requires intervention.
This is important.
If an indicator moves from:
88% → 86%
that may not justify a corrective action.
The change may be within normal variation.
M&E teams should establish reasonable thresholds and decision rules.
For example:
Investigate when performance falls more than 10 percentage points below the project target.
Or:
Review sites with two consecutive periods of declining performance.
The exact rules depend on the project.
The principle is:
Use data to focus attention, not create unnecessary work.
Data quality comes before action
Poor-quality data can produce poor decisions.
Suppose a site suddenly appears to have:
30% performance
but the value resulted from:
- an incorrect denominator,
- duplicate records,
- missing submissions,
- or a reporting error.
Creating a corrective action before checking the data would be inappropriate.
A useful workflow is:
Signal
↓
Validate
↓
Investigate
↓
Act
This protects the organization from reacting to bad data.
Document the reasoning behind important decisions
For significant issues, it can be useful to preserve:
- the original signal,
- supporting evidence,
- analysis,
- finding,
- action,
- owner,
- decision,
- and follow-up result.
This creates an audit trail.
It also helps future teams understand:
Why did we take this action?
That becomes particularly important in long-running programs where staff change over time.
M&E should support both accountability and learning
M&E is sometimes viewed primarily as a reporting function.
But strong M&E serves two related purposes.
Accountability
Are activities being implemented as expected?
Are commitments being met?
Are corrective actions being completed?
Learning
What is working?
What is not working?
Where are problems recurring?
What should the project adapt?
A data-to-action workflow supports both.
The goal is not more reports
Organizations sometimes respond to weak M&E by producing more reports.
That does not necessarily solve the problem.
If the existing report is not connected to decisions, another report may simply add more information.
The better question is:
What should happen because of what we learned?
That question shifts M&E from reporting volume toward management value.
A mature M&E workflow
A mature workflow can look like this:
Level 1 — Data
Collect field and routine information.
Level 2 — Information
Organize the information by project, site, indicator and reporting period.
Level 3 — Insight
Identify meaningful patterns, gaps, anomalies and risks.
Level 4 — Decision
Determine what requires attention.
Level 5 — Action
Assign specific corrective or improvement actions.
Level 6 — Follow-up
Track completion and verification.
Level 7 — Learning
Determine whether the intervention improved the situation.
This is the progression from:
Data
to:
Operational intelligence.
A simple test for your M&E system
Ask your team to choose one problematic indicator.
Then ask:
Can we identify the affected sites?
If yes:
Can we see their recent monitoring history?
If yes:
Can we see the findings?
If yes:
Can we see the corrective actions?
If yes:
Can we see who owns those actions?
If yes:
Can we see which actions are overdue?
If yes:
Can we determine whether the issue improved?
If the answer is "no" at several stages, the organization may have a gap between M&E reporting and operational follow-up.
How to improve the workflow without rebuilding everything
You do not need to transform the entire M&E system overnight.
Start with one project.
Step 1
Define the project's key management questions.
Step 2
Identify the most important indicators.
Step 3
Establish reliable project and site records.
Step 4
Connect monitoring visits to sites.
Step 5
Structure findings.
Step 6
Convert important findings into actions.
Step 7
Assign owners and deadlines.
Step 8
Track action status.
Step 9
Review whether actions actually resolved the underlying problem.
Step 10
Use recurring patterns to improve the broader program.
This creates an incremental path from reporting to operational M&E.
Conclusion
M&E data is valuable only when it helps an organization understand what is happening and decide what to do next.
Collecting data is necessary.
Reporting it is useful.
Analyzing it is important.
But the real management value appears when the organization can move from:
Data
to:
Insight
to:
Decision
to:
Action
to:
Follow-up
to:
Learning
A KoboToolbox submission can tell you what was recorded during a field visit.
An ODK submission can provide structured field information.
DHIS2 can provide routine performance data.
An Excel analysis can reveal trends.
But none of those pieces, by themselves, necessarily creates a complete operational workflow for managing the response.
That requires connecting the information to the things the organization actually manages:
Projects
Sites
Visits
Findings
Actions
Performance
The goal is not to collect more data.
The goal is to make the data you already collect useful for decisions.
Good M&E does not end with a report. It ends when the organization learns something, acts on it, and checks whether the action made a difference.
FieldOps provides an operational layer for organizations that want to connect monitoring activity, site-level performance, findings, corrective actions and follow-up without necessarily replacing the field-data and routine reporting systems they already use.
The question every M&E team should ultimately be able to answer is simple:
"We found the problem. What happened next?"
Key Takeaways
-
Collecting M&E data is not the same as using it for decisions.
-
Start with the management question or decision rather than collecting data without a defined purpose.
-
A performance signal should trigger investigation rather than automatically being treated as a finding.
-
Operational M&E should allow teams to move from organization-level information to project, site and issue-level detail.
-
Findings and corrective actions are different: a finding describes what was observed, while an action defines what should happen next.
-
Every important corrective action should have an owner and deadline.
-
Action completion does not necessarily mean that the underlying problem was resolved.
-
Follow-up should determine whether the situation actually improved.
-
Recurring findings can reveal systemic problems that require program-level intervention.
-
Combining multiple signals can help organizations prioritize which sites require attention.
-
Trends are often more informative than isolated indicator values.
-
Data should be validated before management acts on unexpected results.
-
Dashboards are more useful when they help managers identify what requires attention rather than simply displaying more charts.
-
KoboToolbox and ODK can collect field information while an operational layer manages the resulting monitoring workflow.
-
DHIS2 can provide routine performance information that becomes more useful when considered alongside project and site-level operational context.
-
The ultimate objective of M&E is not more reporting; it is better decisions, action, learning and adaptation.
Frequently Asked Questions
What does it mean to turn M&E data into actionable insights?
It means moving beyond reporting numbers to identify meaningful signals, investigate their context, determine what requires attention, assign actions and follow up on the results.
What is the difference between M&E data and actionable insight?
M&E data describes observations or measurements. An actionable insight interprets that information sufficiently to indicate where attention may be required and what decision or investigation should follow.
How can NGOs make their M&E data more useful?
NGOs can connect indicators to projects and sites, identify meaningful performance signals, investigate those signals, structure findings, assign corrective actions and track whether the actions produced the desired improvement.
How do you turn monitoring data into action?
A practical workflow is:
Collect → Validate → Analyze → Identify signal → Investigate → Record finding → Create action → Assign owner → Follow up → Measure result.
Why do M&E teams collect data but still struggle to make decisions?
Data may be fragmented across forms, spreadsheets, databases and reporting systems. Teams may also lack a structured process connecting findings to responsible people, deadlines and follow-up.
What makes an M&E finding actionable?
A useful finding should provide enough context to understand what was observed, where it occurred, when it occurred, its significance and what evidence supports it. Important findings should be connected to specific actions.
What is the difference between a finding and a corrective action?
A finding describes an observed issue or condition. A corrective action defines what should be done in response to that finding.
Why should corrective actions have owners?
Without an owner, responsibility is ambiguous. Assigning an owner makes it possible to determine who is responsible for implementing and reporting on the action.
Why do corrective actions need deadlines?
Deadlines allow teams to distinguish actions that are progressing from actions that are overdue and provide a basis for follow-up.
Does completing a corrective action mean the problem is solved?
No. Completing an action confirms that the planned activity occurred. Follow-up is still required to determine whether the underlying problem was actually resolved.
How can M&E teams identify sites that need attention?
Organizations can combine signals such as below-target performance, declining trends, overdue monitoring, high-severity findings, overdue corrective actions and recurring findings to prioritize sites for investigation.
Can KoboToolbox data be used for actionable M&E?
Yes. KoboToolbox can provide valuable field information. To make that information operational, organizations may need a workflow that connects submissions to projects, sites, findings, corrective actions and follow-up.
Can ODK data be used for M&E decision-making?
Yes. ODK can collect structured field data that supports monitoring and evaluation. The resulting information can be incorporated into an operational workflow for analysis, findings and follow-up.
Can DHIS2 data be used alongside monitoring data?
Yes. Selected DHIS2 performance information can provide useful context when reviewing project sites and monitoring findings, particularly in health programs. The systems should be connected using reliable site, indicator and reporting-period mappings.
Does integrating M&E data automatically prove why performance changed?
No. Integrated data can reveal patterns and relationships that require investigation. It should not automatically be interpreted as proof of causation.
What is operational M&E?
Operational M&E connects monitoring information to the activities required to manage implementation. It links projects, sites, visits, findings, actions, responsibilities, deadlines and follow-up.
What should an actionable M&E dashboard show?
A useful management view may show performance against targets, sites requiring attention, overdue monitoring, high-severity findings, overdue corrective actions and important trends. The most useful dashboards allow users to drill into the underlying projects and sites.
How does FieldOps help turn M&E data into action?
FieldOps provides a structured operational workflow connecting projects, sites, monitoring visits, findings, corrective actions and follow-up. It is designed to help organizations move from monitoring information to managed operational response.
Does FieldOps replace KoboToolbox or ODK?
Not necessarily. Organizations can continue using KoboToolbox or ODK for field data collection while using FieldOps as an operational layer for project sites, monitoring visits, findings, corrective actions and follow-up.
Does FieldOps replace DHIS2?
No. DHIS2 can continue serving as a routine health information system while selected performance information is connected to project and site operations.
What is the most important question an M&E system should answer?
One of the most useful questions is:
"We identified a problem. What happened next?"
A strong M&E workflow should make the answer visible.
Move beyond data collection
FieldOps helps NGOs manage field visits, monitoring templates, findings, corrective actions, dashboards and donor reporting in one operational intelligence platform.
Learn more about FieldOps