Why Traditional NGO Monitoring Tools Are No Longer Enough
Traditional monitoring tools helped NGOs move from paper to digital forms. But many organisations now need a connected system for field visits, findings, corrective actions, dashboards and donor reporting.

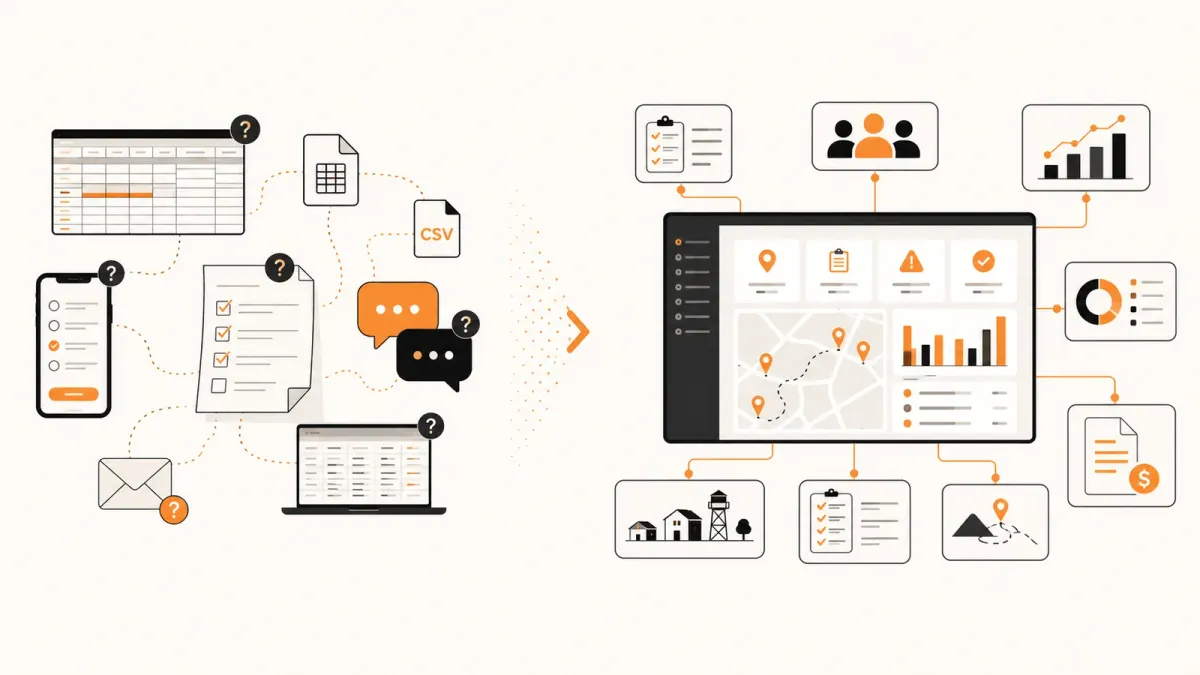
Traditional monitoring tools helped NGOs move from paper to digital forms. But many organisations now need something bigger: a way to connect field visits, indicators, findings, corrective actions, dashboards and donor reporting into one operational system.
The problem is not that tools like KoboToolbox, ODK or Excel are bad. The problem is that NGO operations have outgrown a workflow built mainly around collecting data.
Key Takeaways
- Traditional monitoring tools are useful, especially for surveys, assessments, baseline studies and structured field data collection.
- The weakness appears when organisations need to manage the full lifecycle after data is collected.
- Most NGO monitoring challenges are not caused by lack of data, but by disconnected workflows.
- Field teams, MEL teams, programme managers and donor reporting teams often work from different versions of the truth.
- Operational Intelligence connects monitoring data to decisions, actions, accountability and reporting.
- The future of NGO monitoring is not replacing KoboToolbox, ODK or Excel. It is integrating them into a wider operational system.
The spreadsheet was not the problem
In many NGOs, the monitoring system begins innocently.
A programme officer creates an Excel tracker. A MEL officer builds a Kobo form. A field coordinator opens a WhatsApp group to follow up on site visits. A data manager exports submissions every Friday. A programme manager prepares a donor update from three different files and a few calls to the field.
At first, this works.
The project is small. The team knows each other. The number of sites is manageable. The donor report is still months away. Everyone can remember which school had the water tank issue, which health facility had missing registers, and which community group had not yet received training materials.
Then the programme grows.
Twenty sites become eighty. One donor becomes three. One reporting template becomes several. Kobo forms multiply. Excel files multiply. Different teams start naming the same site differently. Field visits are completed, but findings are buried inside submissions. Corrective actions are discussed in meetings, but not tracked to closure. Dashboards exist, but they show data after the decision window has already passed.
At that point, the spreadsheet is blamed.
But the spreadsheet was not the real problem.
The real problem was that the organisation was trying to manage a complex field operation using tools designed for narrower tasks.
The issue is not whether an NGO uses digital tools. The issue is whether those tools help the organisation manage operations from evidence to action.
Traditional monitoring tools solved an important problem: they made data collection faster, cleaner and more structured. That was a major improvement over paper forms, handwritten reports and manual data entry.
But field operations are no longer just about collecting data.
They are about knowing what is happening, where it is happening, who is responsible, what has changed, what needs attention, and whether the organisation is learning quickly enough to improve.
That is a different problem.
What traditional monitoring tools were built to do well
Before criticising traditional tools, it is worth being fair.
Many of them are excellent at the job they were designed to do.
KoboToolbox is widely used by humanitarian and development organisations because it makes field data collection practical in difficult environments. ODK has helped thousands of teams collect structured data offline, manage form submissions and run mobile data collection workflows. Excel remains one of the most flexible tools ever created for analysis, cleaning, tracking and reporting.
These tools deserve respect.
They helped NGOs move away from paper-heavy monitoring systems. They reduced transcription errors. They made offline data collection possible. They allowed teams to standardise questionnaires and export data for analysis. They lowered the cost of collecting evidence.
For many use cases, they are still the right tools.
| Tool category | What it does well | Typical NGO use case |
|---|---|---|
| Digital form tools | Structured data collection | Baselines, assessments, surveys, spot checks |
| Excel trackers | Flexible analysis and ad hoc reporting | Activity trackers, donor tables, budget-linked monitoring |
| Dashboard tools | Visualising trends and summaries | KPI dashboards, programme performance views |
| Messaging apps | Fast coordination | Field updates, urgent follow-up, informal clarifications |
| Shared drives | Document storage | Reports, photos, templates, approvals |
The problem begins when these tools are expected to do everything.
A form tool is not a field visit management system.
A spreadsheet is not an accountability workflow.
A dashboard is not a corrective action tracker.
A WhatsApp message is not an audit trail.
A shared drive is not a source of operational truth.
Each tool may work well on its own. The operational weakness appears in the gaps between them.
The old monitoring workflow
Many NGO monitoring systems still follow a workflow that looks like this:
- Create a monitoring form.
- Send field officers to collect data.
- Export submissions.
- Clean the data.
- Analyse the data.
- Prepare a report.
- Discuss findings in a meeting.
- Follow up manually.
This workflow made sense when the main challenge was lack of data.
But today, many NGOs have plenty of data. They have Kobo submissions, ODK exports, Excel trackers, Power BI dashboards, GIS points, photos, attendance sheets, field visit notes and donor reporting templates.
The challenge has shifted.
The question is no longer:
How do we collect more data?
The better question is:
How do we turn field information into timely operational decisions?
That shift changes everything.
If a field visit identifies that a health facility has stock-outs, the organisation does not only need that answer stored in a submission table. It needs to know whether this is new or recurring, whether the issue affects other facilities, who should act, whether a corrective action has been assigned, whether the issue has been resolved, and whether the donor report should mention it.
Traditional monitoring tools usually capture the observation.
They do not always manage the operational consequence.
Where traditional monitoring tools start to break
The weakness is rarely visible on day one. It appears gradually as programmes become more complex.
1. Field visits are treated as forms, not operational events
A field visit is more than a submitted questionnaire.
It has a purpose, a location, a team, a date, a programme, a project, a site, a set of indicators, observations, findings, risks, actions and sometimes approvals.
When a monitoring tool treats the visit mainly as a form submission, important operational context can disappear.
For example:
| Field visit reality | What often gets captured |
|---|---|
| Visit was part of a quarterly supervision plan | A submitted form |
| Facility had unresolved issues from the previous visit | A few repeated answers |
| Programme officer promised follow-up | A comment field |
| Site needed escalation | A note in a meeting |
| Donor indicator was affected | Discovered during reporting |
This is why many organisations feel busy collecting data but still struggle to manage visits.
They know a form was submitted.
They do not always know whether the visit achieved its operational purpose.
2. Findings are buried inside submissions
A finding is different from an answer.
An answer says:
The facility does not have updated patient registers.
A finding says:
The facility has a documentation gap that may affect service quality reporting and requires follow-up before the next donor reporting period.
That difference matters.
Traditional tools are good at storing answers. But programme teams often need findings to be categorised, prioritised, assigned, tracked and closed.
Without a findings workflow, serious issues hide inside datasets.
A dashboard may show that 23% of facilities lack updated registers. But who owns the follow-up? Which facilities are affected? Which issues are urgent? Which ones were resolved? Which ones are recurring? Which ones need escalation?
If the answer lives in a spreadsheet, an email thread or someone's memory, the monitoring system is incomplete.
3. Corrective actions live outside the monitoring system
This is one of the biggest gaps.
A field team identifies a problem. The issue is discussed in a meeting. Someone agrees to follow up. A deadline is mentioned. Then the team moves on.
Two weeks later, the same issue appears again.
Not because the organisation did not care. Not because the field team was lazy. But because the corrective action was not managed as part of the monitoring workflow.
A useful monitoring system should answer:
- What issue was found?
- Who is responsible?
- What action was agreed?
- When is it due?
- What evidence confirms closure?
- Is this issue recurring?
- Does it affect donor reporting?
Many traditional monitoring setups cannot answer these questions without manual follow-up.
That is where accountability weakens.
4. Dashboards show what happened, but not what to do next
Dashboards are valuable. Power BI, Tableau and similar tools can help teams see patterns, compare locations and monitor indicators.
But a dashboard is not the same as an operational management system.
A dashboard may show that training completion is below target in three counties. That is useful. But the programme manager still needs to know why, which sites are affected, whether visits have been scheduled, whether findings have been assigned, whether the delay is linked to partner performance, and what action is underway.
In many organisations, dashboards become the end of the data pipeline rather than the beginning of action.
They are reviewed during meetings, screenshots are pasted into reports, and then the actual follow-up happens elsewhere.
That creates a gap between visibility and action.
A dashboard can tell you where performance is weak. Operational Intelligence helps you manage the work required to improve it.
5. Donor reporting becomes a reconstruction exercise
Anyone who has prepared donor reports from scattered monitoring systems knows the feeling.
The report asks for progress against indicators. That data is in the dashboard.
It asks for activities completed. That is in an Excel tracker.
It asks for challenges. Those are in field visit notes.
It asks for corrective actions. Those are in meeting minutes.
It asks for evidence. Photos are in shared folders.
It asks for explanation. That lives in people's heads.
So the team reconstructs the programme story manually.
This is exhausting. It also increases risk.
When reporting depends on manual reconstruction, the organisation may miss important context, over-rely on a few staff members, or submit reports that show numbers without explaining the operational reality behind them.
A stronger system should make donor reporting a natural output of good operational management, not a separate emergency every quarter.
The hidden cost of disconnected monitoring tools
Disconnected tools do not always look expensive on paper.
Kobo may be free or low-cost. Excel is already available. WhatsApp is already installed. Shared drives are already part of the organisation's workflow.
But the real cost appears in staff time, duplicated effort, delayed decisions and weak accountability.
| Hidden cost | How it appears in NGO operations |
|---|---|
| Manual reconciliation | Staff spend hours matching site names, visit dates and indicator labels across files |
| Late decisions | Issues are discovered during reporting instead of during implementation |
| Weak accountability | Actions are agreed but not tracked to closure |
| Reporting stress | Teams rebuild the programme story from scattered files |
| Loss of institutional memory | Knowledge disappears when staff leave or projects transition |
| Duplicated data collection | Field teams collect similar information because previous data is hard to find |
| Inconsistent definitions | Different teams use different indicator names, site names or reporting periods |
None of these problems is dramatic on its own.
Together, they create operational drag.
The organisation feels slower than it should be. Managers ask for updates that should already be visible. MEL teams become report producers instead of learning partners. Field teams feel overburdened by repeated requests. Donors ask questions that require another round of manual checking.
This is not a technology problem only.
It is an operating model problem.
Why the NGO sector is outgrowing form-first monitoring
The form-first approach assumes that the main unit of monitoring is the form.
That made sense when digital transformation meant replacing paper forms with mobile forms.
But modern NGO operations are more complex.
A programme may have multiple donors, multiple indicators, several implementing partners, different site types, recurring field visits, compliance requirements, safeguarding considerations, GIS requirements, evidence attachments, dashboards, adaptive management meetings and strict reporting deadlines.
In that environment, the main unit of monitoring is not the form.
It is the operational workflow.
A form is only one part of that workflow.
The workflow includes:
- Planning what should be monitored.
- Scheduling or recording field visits.
- Capturing observations and indicator data.
- Identifying findings.
- Assigning corrective actions.
- Tracking closure.
- Updating dashboards.
- Preparing donor reports.
- Learning and adapting.
When tools only manage one or two steps, teams must bridge the rest manually.
That is why organisations start asking for “a better monitoring system” even when they already have good data collection tools.
They are not always asking for a better form builder.
They are asking for a better way to run the monitoring operation.
A practical example: the quarterly field supervision problem
Imagine an NGO running a maternal health programme across 60 facilities.
Each quarter, supervisors visit facilities to review service readiness, data quality, staffing, stock levels, community referrals and documentation. The MEL team uses Kobo to collect supervision data. The programme team uses Excel to track facility visits. The data manager exports Kobo submissions into Power BI. The project manager prepares a donor update every quarter.
On paper, this looks digitised.
But here is what happens in practice.
| Step | Tool used | Operational gap |
|---|---|---|
| Visit plan | Excel | Not connected to submitted supervision forms |
| Facility checklist | Kobo | Captures answers but not full follow-up workflow |
| Site coordinates | Kobo/GPS | Not always linked to official site records |
| Findings | Free-text fields | Difficult to prioritise and assign |
| Corrective actions | Meeting notes | No structured tracking to closure |
| Dashboard | Power BI | Shows trends but not action ownership |
| Donor report | Word/Excel | Reconstructed manually from several sources |
Now suppose supervisors find that 18 facilities have incomplete maternity registers. Eight have recurring stock-outs. Five have unresolved infrastructure issues. Three have data quality concerns that may affect the next donor report.
A traditional monitoring setup can collect this information.
But the programme manager needs more than collection.
They need to know:
- Which issues are urgent?
- Which facilities had the same issue last quarter?
- Which action belongs to the county coordinator?
- Which action belongs to the implementing partner?
- Which findings affect donor indicators?
- Which issues remain open before the reporting deadline?
- What evidence shows that a facility improved?
That is operational intelligence.
Not more data. Better connected data.
Monitoring maturity: from forms to Operational Intelligence
One useful way to understand the shift is to think in maturity levels.
| Level | Description | Typical tools | Main limitation |
|---|---|---|---|
| Level 1: Paper-based monitoring | Field data captured on paper and entered later | Paper, Word, Excel | Slow, error-prone, difficult to analyse |
| Level 2: Digital data collection | Forms are digitised and submissions exported | KoboToolbox, ODK, SurveyCTO | Better data capture, but limited operational workflow |
| Level 3: Dashboard-driven monitoring | Data is visualised for programme review | Power BI, Tableau, Looker Studio | Visibility improves, but action tracking remains separate |
| Level 4: Integrated monitoring operations | Visits, indicators, findings and actions are connected | Monitoring platform + integrations | Requires process discipline and system adoption |
| Level 5: Operational Intelligence | Data continuously supports decisions, accountability and adaptation | Integrated platform + BI + workflows | Requires leadership commitment and consistent use |
Most NGOs are somewhere between Level 2 and Level 3.
They collect data digitally. They may have dashboards. They may even have strong MEL frameworks.
But they still manage many operational decisions manually.
The next step is not simply adding another dashboard.
It is connecting monitoring evidence to operational workflows.
What a modern NGO monitoring system should include
A modern monitoring system should not force NGOs to abandon tools they already use well. Instead, it should provide the operational layer around them.
At minimum, it should support the following capabilities.
1. Field visit management
The system should know that a visit happened, where it happened, why it happened, who conducted it, which programme it belonged to and what was observed.
This matters because visits are often the foundation of field supervision, quality assurance and programme learning.
2. Monitoring templates and indicators
Organisations need consistency without becoming rigid.
Monitoring templates help teams standardise what they collect across visits, sites or projects. Indicators help connect field observations to programme results and donor commitments.
A good system should allow structured monitoring while still supporting context-specific observations.
3. Integration with KoboToolbox and ODK Central
Many NGOs already use KoboToolbox and ODK effectively. A modern system should respect that investment.
Instead of replacing those tools, it should import or synchronise submissions, map fields to monitoring structures, and connect collected data to visits, sites, dashboards and follow-up actions.
4. Excel import
Excel is not going away.
It remains essential because donors, partners and field teams still exchange data in spreadsheets. A practical monitoring system should import Excel data safely, validate it, map columns and preserve auditability.
The goal is not to shame Excel users.
The goal is to stop Excel from becoming the only place where operational truth exists.
5. Findings management
Findings should be first-class objects, not buried comments.
They should have categories, severity, responsible teams, due dates, status, evidence and links to visits or indicators.
This is how monitoring becomes actionable.
6. Corrective action tracking
A finding without follow-up is only an observation.
Corrective actions should be assigned, tracked, updated and closed with evidence. This creates accountability and protects institutional memory.
7. GIS and GPS
Location matters in field operations.
A modern system should support site mapping, GPS verification and location-aware analysis. This is especially important for programmes covering many facilities, schools, communities, water points or distribution sites.
8. Dashboards and BI access
Dashboards should not be isolated from operations.
They should draw from structured monitoring data and help managers see trends, risks, performance gaps and follow-up status.
For larger organisations, Power BI, Tableau and BI API access are important because data teams need flexibility.
9. Donor reporting support
Donor reporting should be easier because the system already contains the operational evidence.
That means visits, indicators, findings, actions, evidence and dashboards should connect naturally to reporting outputs.
10. Audit trails and role-based access
NGOs operate in accountability-heavy environments.
A modern system should show who changed what, when, and why. It should also respect roles across headquarters, country offices, projects, partners and field teams.
Traditional monitoring tools versus Operational Intelligence platforms
The distinction is not about old versus new.
It is about scope.
| Question | Traditional monitoring tools | Operational Intelligence platform |
|---|---|---|
| What is the main focus? | Collecting data | Managing field operations from data to action |
| What is the main unit? | Form or dataset | Visit, site, finding, action, indicator and report |
| What happens after data collection? | Export, clean, analyse, report | Review, assign, track, dashboard, report and learn |
| Where do corrective actions live? | Often outside the system | Inside the workflow |
| How are dashboards connected? | Usually through exported datasets | Connected to operational records and workflows |
| How is donor reporting supported? | Manual compilation | Evidence is structured throughout implementation |
| What happens when staff leave? | Knowledge may be scattered | Operational history remains in the system |
| How does the system treat Kobo/ODK? | Primary collection tool | Integrated source of field data |
This is why FieldOps positions itself as an Operational Intelligence Platform rather than a data collection tool.
The aim is not to replace every system an NGO already uses.
The aim is to connect the operational pieces that usually sit apart.
When traditional tools are still enough
There are situations where a full operational platform may be unnecessary.
Traditional tools may be enough when:
- The project is short-term.
- The team is small.
- Data collection is one-off.
- There are few sites.
- Findings do not require formal follow-up.
- Donor reporting is simple.
- The organisation does not need multi-team accountability.
- Dashboards are mainly for summary analysis.
For example, if a team is conducting a one-week needs assessment after a flood, a Kobo form and a clean analysis workflow may be perfectly adequate.
If a researcher is conducting a baseline survey, ODK may be the right tool.
If a project officer is tracking a small pilot with ten sites, Excel may be sufficient.
The point is not to over-engineer every monitoring process.
The point is to recognise when the operational complexity has outgrown the toolchain.
Signs your NGO has outgrown traditional monitoring tools
Here is a practical checklist.
Your organisation may need a more integrated monitoring system if:
- Field visits are planned in one place and recorded in another.
- Different teams use different site names or indicator labels.
- Findings are stored as free-text comments that are hard to track.
- Corrective actions are followed up through WhatsApp, email or meeting notes.
- Dashboards show issues but do not show action ownership.
- Donor reporting requires manual reconstruction from many files.
- Programme managers often ask MEL teams for updates that should already be visible.
- Field teams complain about repeated data requests.
- The organisation struggles to know which issues are open, overdue or recurring.
- A staff transition would make it hard to understand the history of a site or project.
If several of these are true, the problem is probably not the form tool.
The problem is the operating system around monitoring.
A decision framework for NGO teams
Before choosing or replacing tools, ask five questions.
1. Are we solving a data collection problem or an operations problem?
If the issue is poor form design, weak enumerator training or inconsistent submissions, improve the data collection process.
If the issue is follow-up, accountability, reporting and decision-making, you need a wider operational workflow.
2. Where does the work go after data is collected?
Map the journey after submission.
Does the data move into dashboards? Does someone review it? Are findings created? Are actions assigned? Are decisions recorded? Does the donor report use the same evidence?
The weakness is often after submission, not before it.
3. What information do managers ask for repeatedly?
Repeated questions reveal system gaps.
If managers keep asking, “Which sites still have unresolved issues?” the system should answer that directly.
If they keep asking, “Who followed up on the last supervision visit?” the system should show it.
4. What would break if one key staff member left?
This is one of the best tests of operational maturity.
If programme history, reporting logic, site context or follow-up commitments live mainly in one person's files or memory, the system is fragile.
5. Can we explain performance, not just measure it?
Monitoring should not only say whether a target was met.
It should help explain why performance is improving, declining or stuck.
That requires connecting numbers to field context.
Common mistakes when modernising NGO monitoring
Mistake 1: Replacing tools before understanding workflows
Some organisations jump from one tool to another without mapping how work actually happens.
They replace a form builder, but the real problem was action tracking.
They buy a dashboard tool, but the real problem was inconsistent site records.
They build a database, but the real problem was lack of ownership after findings are raised.
Start with the workflow.
Then choose the tools.
Mistake 2: Treating dashboards as the final answer
Dashboards are powerful, but they do not automatically create accountability.
A dashboard can show that a project is behind target. It cannot, by itself, assign responsibility, follow up actions or document why a decision was made.
Dashboards should be connected to management routines.
Mistake 3: Ignoring field team realities
A system that works only for headquarters will fail.
Field teams need tools that reduce duplication, work with poor connectivity, respect their time and provide value back to them.
If field officers only experience monitoring as extraction, adoption will be weak.
Mistake 4: Designing only for donor reporting
Donor reporting is important, but it should not be the only reason monitoring exists.
A good system helps the organisation manage better during implementation, not only report afterwards.
Mistake 5: Forcing everything into one tool
Integration is often better than replacement.
KoboToolbox may remain the best way for a field team to collect certain forms. Power BI may remain the best dashboarding environment for a data team. Excel may remain necessary for partner uploads.
The question is how these tools connect into a coherent operating model.
What this means for MEL teams
MEL teams are often placed in a difficult position.
They are expected to design indicators, manage data quality, support reporting, produce dashboards, explain performance, help programmes learn and sometimes troubleshoot every data issue in the organisation.
When systems are disconnected, MEL teams become human integration layers.
They copy data from one place to another. They clean repeated exports. They chase programme teams for explanations. They manually update donor tables. They remind people about unresolved findings.
This is not the best use of MEL expertise.
MEL teams should spend more time interpreting evidence, facilitating learning and improving programme decisions.
They should spend less time stitching together fragmented systems.
Operational Intelligence helps by turning monitoring from a reporting function into a management function.
That does not reduce the importance of MEL.
It increases it.
What this means for programme managers
Programme managers do not need another dashboard that requires interpretation by three other people before they can act.
They need a clear view of implementation.
They need to know:
- Which visits happened?
- Which sites were missed?
- Which findings are serious?
- Which actions are overdue?
- Which indicators are at risk?
- Which partner needs support?
- Which issues should be escalated?
Traditional monitoring tools often provide pieces of this picture.
Operational Intelligence brings the pieces together.
For programme managers, this means fewer blind spots and faster course correction.
What this means for data managers
Data managers are often asked to make messy systems look clean.
They receive exports from different tools, align columns, fix site names, build dashboards, maintain spreadsheets and respond to urgent data requests.
A more integrated system does not remove the need for data management. It makes data management more strategic.
Instead of spending most time repairing data flows, data managers can focus on data models, quality rules, BI access, indicator definitions and decision support.
This is especially important when organisations connect monitoring data to Power BI, Tableau or a BI API.
The stronger the operational data model, the more useful the analytics layer becomes.
The role of FieldOps
FieldOps is built around this belief:
NGOs do not only need to collect field data. They need to manage the operational life of that data.
That is why FieldOps focuses on field visit management, monitoring templates, KoboToolbox and ODK Central integration, Excel imports, findings, corrective actions, GIS, dashboards, BI access, donor reporting, audit trails and role-based access.
It does not ask organisations to pretend their existing tools do not matter.
Instead, it recognises the reality of NGO operations.
Some data will come from KoboToolbox. Some will come from ODK Central. Some will arrive through Excel. Some will be entered directly during field visits. Some will feed Power BI or Tableau. Some will support donor reports.
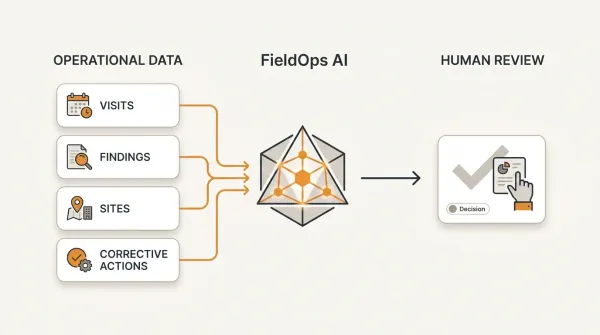
The job of an Operational Intelligence Platform is to connect these flows into a system that helps people act.
That is the real shift.
Not from paper to digital.
From digital data to operational intelligence.
Frequently Asked Questions
Are traditional NGO monitoring tools obsolete?
No. Many traditional tools remain useful. KoboToolbox, ODK and Excel still solve important problems. The issue is that they may not be enough when an organisation needs to manage visits, findings, corrective actions, dashboards and donor reporting as one connected workflow.
Should NGOs stop using KoboToolbox or ODK?
Not necessarily. Many NGOs should continue using them for data collection. The better approach is often to integrate KoboToolbox or ODK Central into a wider operational system that manages what happens after data is submitted.
Is Excel still useful for NGO monitoring?
Yes. Excel remains useful because it is flexible and widely understood. The risk appears when Excel becomes the only operational system and critical information is scattered across files without audit trails, consistent structures or shared visibility.
What is Operational Intelligence for NGOs?
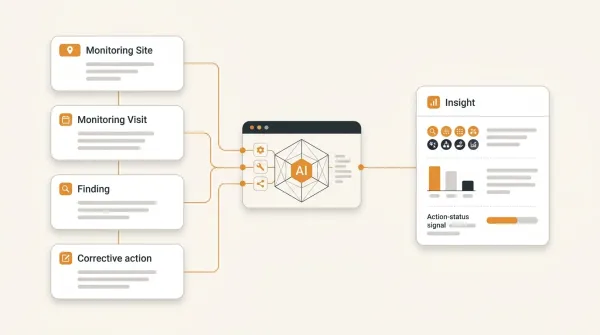
Operational Intelligence is the ability to connect field data, visits, indicators, findings, actions, dashboards and reports so teams can understand what is happening and act in time.
What is the difference between monitoring and Operational Intelligence?
Monitoring focuses on tracking activities, outputs, indicators and changes. Operational Intelligence goes further by connecting monitoring evidence to decisions, accountability, follow-up and learning.
Do small NGOs need an Operational Intelligence Platform?
Not always. Small or short-term projects may work well with KoboToolbox, ODK or Excel. The need becomes stronger when the organisation manages many sites, recurring visits, multiple donors, corrective actions, dashboards and complex reporting.
Can dashboards replace a monitoring platform?
No. Dashboards help visualise information, but they do not usually manage visits, findings, responsibilities, approvals or corrective actions. Dashboards are most useful when connected to a strong operational data system.
How should an NGO start improving its monitoring system?
Start by mapping the full monitoring workflow from planning to reporting. Identify where data is collected, where decisions happen, where follow-up is tracked and where reporting evidence is assembled. The biggest gaps usually appear between tools, not inside one tool.
How Modern Operational Intelligence Platforms Solve This
The next generation of NGO monitoring is not about replacing KoboToolbox, ODK, Excel or Power BI.
It is about connecting them.
Modern Operational Intelligence platforms recognise that organisations rarely rely on a single application.
Field teams may collect information using KoboToolbox.
Partners may submit Excel workbooks.
Data teams may analyse trends in Power BI or Tableau.
Programme managers may need dashboards showing operational performance across multiple projects and donors.
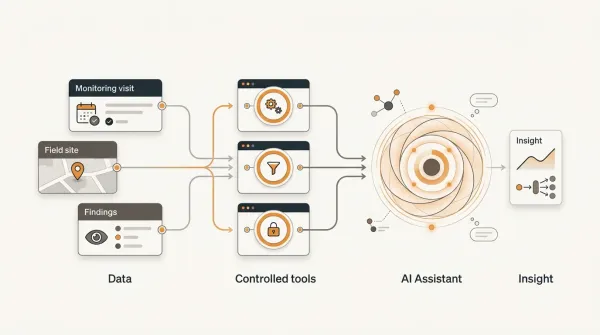
Rather than forcing organisations to abandon these investments, modern platforms create a governed operational layer that connects them into one consistent workflow.
This architecture is built around a few important principles.
Integrate Instead of Replace
Every organisation already has systems that work well for specific tasks.
Operational Intelligence platforms preserve those strengths while eliminating the operational gaps between them.
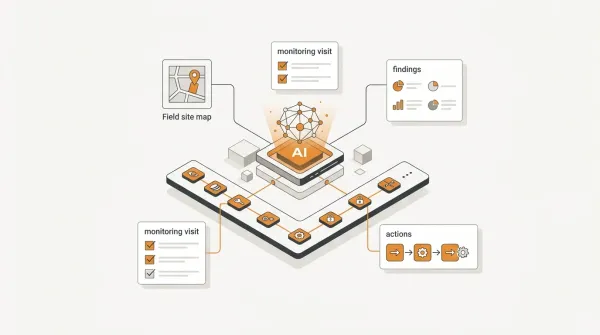
Connect Evidence to Action
Collecting field data is only the beginning.
Monitoring visits should naturally lead to findings.
Findings should generate corrective actions.
Corrective actions should appear in dashboards and donor reporting.
Operational evidence should continue flowing until issues are resolved.
Govern Operational Information
Operational Intelligence depends on consistency.
Sites should have one identity.
Indicators should have one definition.
Visits should follow one lifecycle.
Reporting should draw from one trusted operational model.
This creates confidence in dashboards, donor reports and executive decision-making.
Capture Once. Use Everywhere.
Operational information should never be recreated for every report.
Instead, trusted operational records should support dashboards, analytics, donor reporting and organisational learning from a single governed source.
How FieldOps Implements These Principles
FieldOps was designed to complement—not replace—the tools NGOs already rely on.
Instead of competing with KoboToolbox, ODK Central or Excel, FieldOps connects them into a structured operational workflow that extends beyond data collection.
Field visits become operational records.
Operational records generate findings.
Findings become corrective actions.
Corrective actions feed dashboards, audit trails and donor reporting.
Throughout this lifecycle, FieldOps preserves operational history, standardises KPI definitions, supports enterprise reporting through Microsoft Power BI, Tableau and a secure BI API, and helps organisations scale from individual projects to multi-country programmes without rebuilding their monitoring processes.
The result is not simply better monitoring.
It is better operational management.
It is Operational Intelligence.
Closing thought
Traditional NGO monitoring tools helped the sector make a necessary move from paper to digital data.
That achievement should not be dismissed.
But the next challenge is different.
NGOs now need monitoring systems that help them manage complexity, not just collect submissions. They need to connect field visits to indicators, findings to corrective actions, dashboards to decisions, and donor reports to operational evidence.
That is why the conversation is moving beyond monitoring tools.
It is moving toward Operational Intelligence.
Move beyond data collection
FieldOps helps NGOs manage field visits, monitoring templates, findings, corrective actions, dashboards and donor reporting in one operational intelligence platform.
Learn more about FieldOps